Quality Magazine
  Home
  Subscribe
  Subscribe to eNewsletter
  Subscription Customer Service
  Online
  Industry Headlines
  eXtras
  Blogs
  Quality Product Spotlights
  White Papers on the Web
  Tech ManufactureXPO
  Quality Downloads
  Webinars
  Quality Showcases
  e-Inserts Plus
  Online Store
  More Product Info
  Archive
  Q-Tube
  Q-Cast Podcasts
  Quality Showrooms
  Brain Teasers
  Current Issue
  Coming Events
  Features
  Departments
  Columns
  Products
  Quality Quick Clicks
  Special Sections
  NDT
  Vision & Sensors
  Aerospace
  How To Guide
  China Editions
  Quality Guides
  Quality Buyers Guide
  Software Selector
  Registrars Guide
  Services Guide
  Quality Services
  Job Marketplace
  Industry Links
  Classifieds
  Career Center
  Events
  Quality Expo 2012
  IMTS 2012
  Meetings and Shows
  Industry Webinars
  Quality Awards
  2012 Quality Plant of the Year Nomination Form
  2012 Quality Professional of the Year Nomination Form
  Quality Leadership 100
  Quality Info
  Media Planning Guide
Search in: EditorialProductsCompanies
What Is Your "Data Driven" Score?
by Evan Miller
August 17, 2009

ARTICLE TOOLS
EmailEmailPrintPrintReprintsReprintsshareShare


In last month's post I asked if the term "data driven" is just another buzzword. I argued that "data driven" deserves an operational definition, and proposed a simple two-by-two matrix that could help us develop a common understanding of what it means to be data driven.

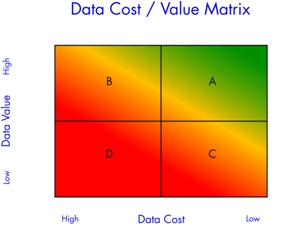
While most people aspire to Quadrant A (low cost and high value data), most don’t live there in reality. Many actually live in Quadrant D (high cost and low value).

While the anecdotal descriptions of the four quadrants that I shared last month are useful, they don’t offer much guidance on what to do about your current reality.

For that reason, I developed a quick and dirty gap analysis that helps you quantify where you are today. Used properly, the gap analysis can point you to some actions that can help you become more data driven.

I use the term gap analysis because it helps you evaluate the gap in your current performance and your performance potential. Sometimes I like to say that your performance potential is how things would work if God ran the process.

Anyhow - here is the Gap Analysis Tool. Just answer the four questions below, then click Continue to answer four more questions. Then Click Results to see where you score.

Once you have your score, use the Back button to review your answers to each question and plot your strategy for improving your business.

Here are some questions that might help you develop a new strategy:
  • Is your score better on the horizontal axis (data cost) or on the vertical axis (data value)? If you’re firmly in Quadrant C (low cost and low value) it is obvious that you need to work on increasing the value of your data. If both scores are low, look for the low-hanging fruit. Often this is found in data completeness and automation. Automation will free up time from the data shuffle so that you can work at making better use of the data that you’re collecting.
  • Where are your lowest scores? Often bringing one score up from Never to Seldom or Seldom to Sometimes will do a lot to improve your performance.
  • Are your scores balanced across all eight categories, or are some significantly better than others? As a rule, I’d encourage you to seek a balance across all aspects, rather than strive for excellence in one aspect at the expense of the others. These are just some of the ways you can use this data to become more data driven.

    Does your score on this gap analysis reflect the reality of your business? What actions can you take today that will most help your business become more data driven?

    Copyright Hertzler Systems Inc, 2009. Used by permission.


  • Evan Miller
    Evan Miller joined Hertzler Systems Inc. (Goshen, IN) in 1984. For the next seven years he held positions within the company in sales, marketing, technical support and training. In 1991 when founder Paul Hertzler retired from the firm, Miller became president and is now co-owner of the company.

    |PrintEmail
      Comments (0)Post a Comment
     

    No HTML or BBCode in comments please.


    Did you enjoy this article? Click here to subscribe to the magazine.


    Most Emailed Articles

    1. Management: A Closer Look: Understanding Risk Management for Medical Device Manufacturers
    2. Other Dimensions: Does New Stuff Have to be Calibrated?
    3. Auto Industry Goes on U.S. Hiring Binge
    4. Jim’s Gems: Don’t Focus on What Seems Unfair
    5. GD&T Workshop: A Top Down View
    6. Understanding ISO 13485
    7. Test & Inspection: Sensing the Thread
    8. Software & Analysis: FMEAs for the Medical Industry: Which FMEA Type Should I Use?
    9. Shifting the Paradigm: Business System Analyses for Identifying Areas to Improve
    10. ISO 13485: Medical Devices and Risk Management
    Top Searches
    1. Quality 101
    2. Quality Management Systems
    3. quality assurance
    4. quality inspector
    5. quality performance indicators
    6. LEAN Quality Management Systems
    7. surface finish
    8. root cause
    9. variation management
    10. optical inspection
     
    Most Popular Articles
    1. Other Dimensions: Does New Stuff Have to be Calibrated? 01/31/2012
    2. Quality 101: Nondestructive Testing 02/22/2008
    3. Quality 101: An Introduction to Gage R&R 12/01/2005
    4. Understanding ISO 13485 01/02/2008
    5. 50 Years of Quality--Take Another Look at Nondestructive Testing 10/23/2011
    6. Measurement: The Democratization of Measurement 01/27/2012
    7. Aerospace Industry To Face Challenges in 2012 02/07/2012
    8. Quality Measurement: Effects of Screw-Thread Geometry 10/01/2005
    9. U.S. Manufacturing Making a Comeback 02/01/2012
    10. Quality 101: Surface Finish Measurement Basics 09/01/2004
    © 2010 BNP Media. All rights reserved. | Privacy Policy