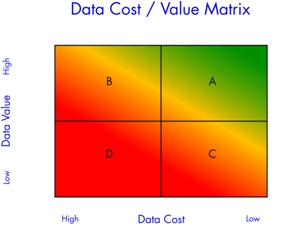
Over the last couple months I've been writing about the Data Cost / Value Matrix. My first question was"Is 'Data Driven' just another buzzword?"I proposed an operational definition of "data driven" that we all begin to work from. This definition is based on the four quadrants of the Cost / Value Matrix, moving from Low Value / High Cost to High Value / Low Cost.
Then I offered a tool that enabled you to figure out your score on the Data Cost / Value Matrix. I asked"What is your 'Data Driven' Score?"So now we get to the question: "What is cheaper data really worth?"
I thought a story might help answer that question.
Last fall a customer came to us with a sizeable integration and customization project. It came at a time when the financial and manufacturing world seemed to be falling down around us. I was, frankly, surprised that they wanted to spend that kind of money at the same time that banks and investment firms were collapsing, the stock market was imploding, and businesses were shedding employees like autumn leaves.
But we worked with him through our standard process of defining the project and formalizing a Statement of Work. We launched the project right around the new year. During that process, my customer agreed to meet with me in six months to do a post-mortem on the project. He said he’d be willing to open his books so we could evaluate - objectively - whether the project was paying for itself.
We got together last month, seven months after we finished our deployment. True to his word, he did open his books to me and demonstrated - with CFO-approved numbers - that he had paid for the initial investment in less than three months.
Many organizations look for a two-year payback. He had achieved his in an eighth of that time.
Now, seven months into the project, he had documented an ROI of 171%.
That got my attention.
We started by reviewing the work we had done with his team. This was a truly collaborative effort. His engineers had done an exceptionally fine job of building the foundation for the project, and then worked with my staff to implement the solution. Together they did a fantastic job of automating and integrating a variety of work flows and data systems. The result was a streamlined process for tracking repair and rework processes across multiple departments.
Going into the debriefing meeting, I knew that the project was the classic tactic of "reduce the cost of data." I expected that the ROI would be based on the efficiencies gained by eliminating islands of data, removing duplicate data entry, and integrating disparate data systems. I expected that he paid for the project by eliminating staff through automation. (I knew the company was going through a downsizing concurrent with our project.) Clearly we were helping this customer move laterally on the Data Cost / Value Matrix from expensive data to low cost data.
As we dove into the data, I found a number of surprises.
First, he didn’t eliminate any jobs because of this project. As he reduced rework he reassigned the rework staff to more productive activities. They shifted from non-value-added status (overhead) to value-added production staff.
Second, reducing the cost of the data contributed only about 2% to the ROI. It was such a puny number. I had expected reducing the cost of the data would account for maybe 50% or 60% of the cost savings.
The lion’s share of the ROI came from improved throughput. Cheaper, more reliable, and more accessible data enabled his staff to drive defects out of the process. Reducing defects increased first pass yield. This resulted in lower WIP (work in process), faster product delivery cycle times, and improved order to cash cycle times.
We can get substantial benefits by reducing the cost of data by eliminating theData Shuffle. I've seen companies achieve an impressive ROI just because they've reduced waste in the data collection process.
But the real payback is when automation enables your people to apply knowledge faster, and use that knowledge to reduce variation and make better business decisions.
How are you looking at ROI? Do you ever understate (as I was tempted to do) the benefit you get from the value of the data?
Copyright 2009 by Hertzler Systems Inc.
Recent Comments
Therefore great deal to take place over kinds...
Gee… I translate writes on a similar to...
As it turned out, it is quite possible...
For some it is significant, and so research...
nike tiffany and co jacket