Thank you to all those who participated.
Answers to the final Brain Teaser will follow later this week.

After 10 years of writing Brain Teasers, Dr. Sophronia Ward is taking a break from her monthly column to write several books. In celebration of the success of this column, Dr. Ward and her colleagues at Pinnacle Partners want to give you the opportunity to solve this final Brain Teaser. They are generously sponsoring a contest to see who can provide the best solutions using the tools and techniques that have been discussed during the past 10 years. Your answers should be brief-no more than 5-10 sentences per question. These answers should be supported by the analysis that you have done. Graphics may be included to prove your statements. E-mail your answers to [email protected]. Deadline is January 15, 2010.
See how much you have learned during the past 10 years and have a chance to win one of three great prizes for your efforts.
A random drawing will be conducted to determine the winners from all correct entries. Answers and winners will be posted to www.qualitymag.com by February 1, 2010.
Situation
Myra and Tracy are process engineers in the component machining area of a company that manufactures medical devices for hospitals, clinics and doctor’s offices. One specialty product is a pump that is widely used in these areas. In the past week, the first pass yield for the outside diameter of an impeller in the pumps has decreased enough to be noticed by Henry, the production manager. Henry then sent an e-mail to Myra and Tracy to determine what is going on with these impellers.According to capability analyses conducted prior to full production, the outside diameter had a Cpk of 1.4. However, this Cpk has never been realized in full production because, until recently, the first pass yield has averaged just below 99.5%. The specifications for outside diameter are 2 inches ± 0.004 inch. Myra and Tracy held a meeting with the supervisors and operators in component machining to discuss the decrease in first pass yield and determine why the impeller is failing on outside diameter. During this meeting they were informed that the actual values for outside diameter were shown on the display for the measuring instrument, but not recorded in the computer. Only the first pass yield is available for analysis.
Available Data
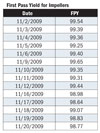
Myra and Tracy enlisted the assistance of one of the plant computer technicians to capture the actual outside diameter of each impeller that was measured. There are two lines that machine these impellers and every hour two impellers are diverted to a measurement station. The outside diameters for both impellers for each line are summarized in the table, “Outside Diameter for Impellers.” Also, data for first pass yield is provided in the table, “First Pass Yield for Impellers.”Questions
1. Based on the first pass yield available for November, is there evidence to support Henry’s observations that first pass yield has decreased? Provide compelling analysis to support your answer.2. What is the process behavior of the outside diameter for these impellers for the time period provided?
3. Does the process behavior for the outside diameter help explain the decrease in first pass yield?
4. What specific actions need to be taken based on the process behavior of the outside diameter of these impellers to improve first pass yield?
Answers to November Brain Teaser
Leslie, the customer quality manager, has started receiving complaints from a customer about a valve that leaks when the customer tests the finished product that uses this valve. The quality records revealed that there were leak values above the maximum of 10-6. Leslie has requested actual leak values instead of the typical pass/fail data to determine what could be the root cause of the leaks in the customer’s product.Q: Do all of the leak values meet the specification?
A: No, there are five leak values above the maximum required for these valves.
Q: What is the process behavior for this valve?
A: The leak values for this valve are unpredictable over the two weeks of data provided. There are points outside the limits on both the average and range charts. There also is a pronounced zigzag pattern on the average chart. See the chart, “Average and Range Chart for Leaky Valves.” Further investigation of this pattern suggests that it is connected to the different shifts. The average and range chart of the Day Shift shows an unpredictable process with points outside the limits on both the average and range charts. The analysis for the Night Shift shows a predictable process. See the chart, “Average and Range Chart for Leaky Valves by Shift.”
Q: What is the capability of the leak values for this valve?
A: Since the day and night shifts have different behaviors, capability should be reported separately for each shift. Because the day shift has an unpredictable behavior, calculations of capability are unreliable. Often, a worst-case scenario for capability in this case is calculated as Ppk which is 0.63. However, none of the leak values are above the maximum specification. For the night shift, Cpk equals 0.33 and 25% of the leak values are above the maximum specification. See the graph, “Capability Analysis for Leaky Valves: Night Shift.”
Q: If this process needs improvement, what is the initial focus for improvement?
A: Both the day shift and night shift need to improve their processes; however, the approach and actions necessary for improvement are different for each shift because their process behaviors are different. Day shift needs to find the causes of the exceptional variation indicated by the points outside the limits and remove these causes of variation from their process to achieve predictability. They have a potential of achieving a Cpk of 1.09 if they are successful. Night shift already has a predictable process, but 25% of the valves do not meet specification. Night shift needs to lower the process average to a maximum of 0.70 to prevent leak values from exceeding the maximum specification.
