Brain Teasers: Improve Productivity by 5%
Anyone who has faced a production problem with a need to solve it by using production data can relate to the notion of a brain teaser. The brain teasers presented here are based on real-world situations encountered by workers in manufacturing environments. The brain teasers have three parts: (1) the situation, (2) available data or other supporting information and (3) questions that various workers need answered for continual improvement. Recommended solutions follow in the next issue and on the Web at Quality Online (www.qualitymag.com).
Situation
Mandy is the new plant manager for one of six production plants that supply Automatic Teller Machines to banks. At the end of the last fiscal year the corporate office set a goal for each plant to achieve a 5% increase in productivity in the current year. Each month during the current fiscal year, the corporation has published the productivity values for each plant and has given awards to those who achieve the 5% increase over the previous year. Mandy has some concern that this approach may reward those plants that are not making the necessary changes to accomplish the goal.Available Data
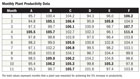
Data for the first 11 months of the current fiscal year are available for all six plants, including Mandy’s. See the table, “Monthly Plant Productivity Data,” for the current fiscal year. Eleven months of data are available. Each data value is calculated as a percent increase from the average productivity for the previous fiscal year.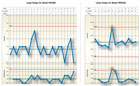
Questions
1. In a given month, if a plant achieves a productivity increase of 5% from the average of the last fiscal year, does this imply that the plant is definitely improving?2. Plant D did not achieve a 5% increase in productivity for any of the first 11 months. Does this mean that Plant D has declined in productivity?
3. Plant F had the highest month’s percent increase in productivity. Does this mean that Plant F has improved productivity the most so far this year?
4. What technique could be used to determine how each plant compares to the others? What can be determined based on the data for the 11 months?
Answers to February Brain Teaser
As a senior engineer for a company that produces process pumps for a variety of industries, Nelson is aware of customer complaints for a recently introduced pump model. The top complaint is “leaky pumps.” There were no complaints about leaks from the earlier pump model. Nelson and his team start their investigation of the cause of the leaks with leak test data for both the new pump model as well as the earlier pump model.Q: What is the behavior of pumps with respect to leaks for both models?
A: The new pump model, PWX350, has behaved unpredictably over the 13 weeks that data were available. In Week 6 there were 53 pumps with leaks, which is an unusual number compared to the other 12 weeks. See the chart, “Leaky Pumps for Model PWX350.” An analysis of the 12 weeks of data excluding Week 6 shows a predicable process with an average of 28.9 or 5.6% leaky pumps. Model PVX300 behaved predictably based on the 22 weeks of data available. The average number of leaky pumps was 1.7 or 0.42%. See the chart, “Leaky Pumps for Model PVX300.”
Q: Do these data give credence to the recent customer complaints for leaky pumps?
A: Yes, the percentage of leaky PWX350 pumps was 5.6% not including the week with the exceptional number of leaky pumps. The percentage of leaky PVX300 pumps was 0.42% during the 22 weeks of available data.
Q: If Nelson and his team want to find out how to solve the problem with leaky pumps in the new model, what additional data should they request?
A: Because the percentage of leaky pumps for the new model is so high when compared to the previous model-5.6% vs. 0.42%-Nelson and his team need to consider both design and production issues when searching for the root causes of the leaks. Data must be collected on the location of the leaks and the specific details about the possible causes of the leaks. For example, the parts of the pump might not fit correctly; there may be components that do not meet specifications; or the assembly techniques lead to a leak in a specific location of the pump.
Q: What monitoring plan for leaky pumps should be put in place?
A: Currently the data on leaky pumps for Model PWX350 are summarized weekly. A monitoring plan should focus on more frequent data collection, such as twice a shift, to begin to find exceptional variation in the process. The data collected on causes of leaks can be useful in setting up the monitoring plan. In addition to the information about the pump leaks, data about the critical characteristics of the components are needed to determine if these characteristics are predictable and capable.
Looking for a reprint of this article?
From high-res PDFs to custom plaques, order your copy today!


