Brain Teasers: Matching Components
Anyone who has faced a production problem with a need to solve it by using production data can relate to the notion of a brain teaser. The brain teasers presented here are based on real-world situations encountered by workers in manufacturing environments. The brain teasers have three parts: (1) the situation, (2) available data or other supporting information and (3) questions that various workers need answered for continual improvement. Recommended solutions follow in the next issue and on the Web at Quality Online (www.qualitymag.com).
Situation
Isaac is a process engineer for a company that makes custom components and assemblies for construction customers. The sales group in his company has assured several customers that these components are specially matched during assembly. Isaac decided to investigate the benefits of the matching program for one assembly of an insert and a socket. He is interested in how two gap measurements behave if the components are assembled randomly compared to the gap measurements when the components are matched.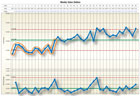
Available Data
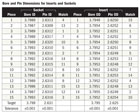
Isaac gathered data from a set of 15 inserts and sockets. He measured the two critical dimensions-bore and pin-on the 15 inserts and the 15 sockets. These data are summarized in the table, “Bore and Pin Dimensions for Inserts and Sockets.” Also included in the table are the numbers used to form the matched assemblies as well as the targets and tolerances for each dimension.Questions
1. What is the process behavior of each dimension for the 15 sockets and inserts? Consider the data are in time order as presented.2. What can you predict about the gaps for bore and pin if the components are assembled randomly?
3. What is the behavior of the gaps for bore and pin for the matched components?
4. What is the benefit of the matching process?
Answers to November Brain Teaser
Amy is the global director of operations for her company and in this capacity she attends many meetings where business information-financial and marketing-is summarized using graphs, some with “trend lines” superimposed over the data. She found these trend lines could obscure the correct interpretation of the data. Many managers were comfortable with the trend lines so Amy decided to present data with and without this line.Q: What message is implied using the data in time order with a trend line?
A: Trend lines imply a constant change from one time period to the next over time for the particular measurement on display. However, not all measurements change by a constant amount each time period.
Q: How can the use of a trend line make it difficult to find important messages?
A: If, as is often the case, a change results from a policy decision or a customer change, the data will experience a step jump-up or down-followed by a sustained flat period at a new average. See the graph of the data without the trend line. In other situations, the changes might be shown by a period of increasing or decreasing values followed by a sustained flat period at a new average. In other words, changes over time rarely have the behavior of a trend in the data values.
Q: Analyze the data using a process behavior chart. What message is communicated using this analysis?
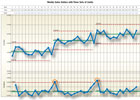
A: The individuals and moving range chart of weekly sales shows that sales are increasing with the first part of the series below the overall average line and the last part of the series above the average line. See the graph “Weekly Sales Dollars.” An analysis of each quarter separately shows that each 13-week period has a different average that is sustained over the 13 weeks. See the graph “Weekly Sales Dollars with Three Sets of Limits.”
Q: What business decisions are impacted by a misinterpretation of data using a trend line?
A: Business decisions such as forecasting, predicting customer complaints, projecting customer orders or sales using trend lines with the data can lead an organization to expect a particular result in the future that is not justified. Using trend lines that do not match the process changes lead to a misunderstanding of the messages in the data and projections that are unsupported.
Looking for a reprint of this article?
From high-res PDFs to custom plaques, order your copy today!


