Situation
For 12 years, Travis worked in production for a company that makes camping equipment for recreation purposes. He recently was transferred back to production from a special assignment on an ISO initiative. Because his background is in engineering, he was assigned the responsibility of monitoring both the specifications of all components and the final product for the two production lines that make collapsible tents. These two production lines are exact replicas of each other.Production Line 1 appears to be running smoothly, but Production Line 2 has had trouble with the final assembly of the internal frames for these tents. Travis decided to start by checking to see how the lengths of frame sections made on each production line compared to specifications. The desired Cpk is 1.33.
Available data
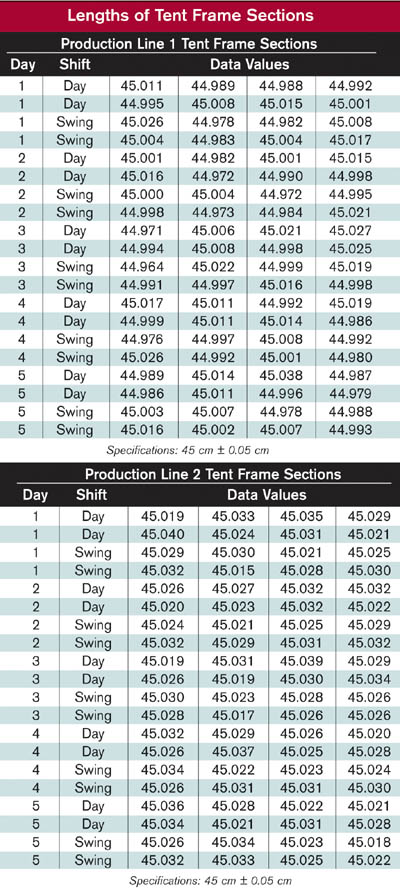
Travis obtained data collected by the quality control (QC) inspectors for each production line at the point where the frame sections are transferred to assembly. Data for frame section lengths are collected twice each shift with a subgroup size of 4. The data for both production lines are shown in the table, "Lengths of Tent Frame Sections." An initial glance at the data values indicates that all tent frame sections meet the specifications for length. One QC inspector told Travis that production Line 1 has a Cpk less than 1, while production Line 2 has a Cpk that is closer to the desired value.
Questions
Is Travis correct in stating that the tent frame sections from both production lines meet specification for length?
What is the behavior of each production line for the length of the tent frame sections?
Which production line is doing a better job of meeting specifications?
Why is production Line 2 having trouble with assembly?
Answers to January Brain Teaser
In her capacity as a chemist for a company that makes rubber products, Cameron is responsible for all batches of rubber meeting specifications. Recently, she learned that even when the rubber meets the current specifications for flash, a characteristic that is connected with the curing of the rubber, the rubber may not cure correctly. Production requires that specifications be much tighter than the ones currently in use.
Q: Are all of the flash values for the 30 batches of rubber meeting the original specifications of 12±3?
A: From a histogram, it is easy to see that all of the batches meet the original specifications of 12±3 for the flash values.
Q: Is the process for making batches of rubber predictable with respect to the flash values?
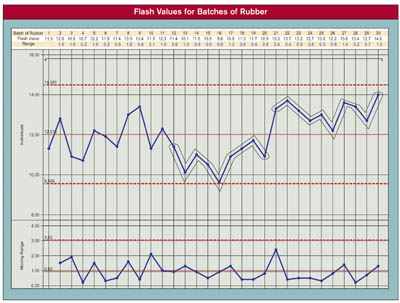
A: The process is not predictable for flash values. The individuals and moving range chart, "Flash Values for Batches of Rubber," shows two long runs of eight or more values. This indicates that the process suffers from changes that are sustained but not severe enough to cause flash to be outside the current specification.
Q: What in the data should raise questions concerning the rubber batches?
A: These sustained changes that make the batches of rubber lower or higher on the average may be associated with the trouble the production line is having in curing. Getting the process to be predictable is the first step toward determining exactly what specifications are required by production for proper curing.
Q: What can Cameron do with the insights from this analysis?
A: Cameron can show both the people making batches of rubber and those working in production the impact of the unpredictable behavior of the flash values.
