
Mismanaged files of CMM reports create confusion and provide few process details. Source: Prolink Software Inc.
The theory and practice behind statistical process control (SPC) can be confusing as well as painful. Moving SPC to the shop floor can add another level of complexity to an already confusing subject. SPC delivers graphical process control information to the people who need it.
Before computers, what little SPC that was done took time because measurements and charting were labor intensive. When computers were added to the mix, things went from bad to worse. After years of struggling with user-hostile software, things eventually got a little easier.
Offline, non-real-time analysis is good for identifying assignable causes, and doing design of experiments and other capability studies. But day-to-day process drift, shifts and other subtle changes can occur suddenly and require constant monitoring in real time. A more timely solution was needed.
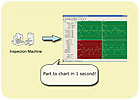
With real-time SPC, inspection results are automatically read, analyzed and displayed within 1 second of inspection completion. Real-time SPC minimizes human intervention.
More live charts and less paper are possible for the quality room and shop floor. The very fact that SPC presents on-screen data in live charts instead of printing a paper report for each inspected part saves time and paper. Large automotive parts can create reports 30 pages or more for each inspected part. These reports consume more than $1,000 per month in toner cartridges, and the report’s life cycle is only 5 minutes-long enough to look at the report’s key features.
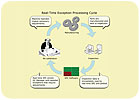
In a real-time exception processing cycle, information flow reaches the QC manager in seconds. Source: Prolink Software Inc.
Excel and paper
Much time is spent creating reports using Microsoft Excel. Excel is one of the more flexible tools for reporting, but the time involved is extensive. It is not just the time needed to make the report templates or supporting macros, it is the day-to-day time spent copying from the coordinate measuring machine (CMM) text report and pasting into pre-made Excel spreadsheets. This does not take into account typographical errors.The data collected from the CMM must be automatic and instantaneous to guarantee timely, accurate and actionable information. Inspecting a part and printing the CMM report is not enough. The report communicates if the part is good or bad, but does not compare the previous parts to give a view of the big picture. Instead, there are 25 pages that do not appear to be connected.
Furthermore, the CMM reports often are created from various machines, in various formats, using various filing systems as personnel changes. File management of thousands of disparate reports creates confusion while providing few process details. Data need to be compared over time to identify trends before they become a problem.
Another approach sends the CMM output directly to a corporate database without attempting to interpret the results. Data is created in a quality lab, saved to the large corporate SPC database, and reports are generated as time permits. With the demands placed on inspectors and quality control (QC) managers, reports may be skipped until a disaster occurs. This only aggravates the daily fire-fighting mode of the QC manager. Data must be timely in order to be useful.
Results in real-time
As the cost of CMMs, video CMMs and other high-speed inspection systems drops, more systems are in use. The CMM has improved the accuracy, repeatability and time to inspect parts. However, the quality manager easily can be overloaded with huge amounts of CMM data. It is easy to have one person attempting to control hundreds or thousands of inspected features. While not all features are critical, tracking five critical features on 100 different parts involves collecting a large amount of data.This is when the value of a real-time SPC program is realized. If the software can quickly filter the raw data into useable information, then one person can easily track 500 critical features. The secret is to monitor in real time and alert the QC manager when there are problems. Otherwise, it is impossible to closely monitor or control hundreds of features.
In a real-time exception processing cycle, information flow can reach the QC manager in seconds. The information has been narrowed down to the details requiring attention. For example, a CMM could send an e-mail communicating that a filet radius on part ABC made in cavity 3 has dropped below an acceptable process capability level. A good, real-time SPC software application will communicate these problems or possible future problems, allowing process adjustments to be made before problems become worse.
When a feature is measured on a part either manually or automatically, the number stands on its own. A graphical view of real-time data depicts the relationship of the separate parts with one another and without employees worrying about losing or misfiling all those paper reports.
Real-time SPC must reduce the amount of data by filtering the dimensions, or plots, to just the critical features. Next, the software must separate, or filter, the parts by data such as cavity, lot, machine fixture or time. This double filtering dynamically changes the real-time screen by showing only the problems.
If the SPC program has dynamic filters that change based on the part just received, it can create and e-mail a report containing the vital information without anyone being present. If the CMM output file contains the machine number that made the part, it can use this information to filter and report problems based on part name, feature name and the condition that occurred. This automation does not require anyone to click on filters. This system saves the QC manager time by forcing the problems to identify themselves.
Placing a computer monitor displaying quality feedback on the shop floor aids machine operators. Source: Prolink Software Inc.
On the shop floor
Placing a computer monitor displaying quality feedback on the shop floor aids machine operators. Parts made by a particular machine, fixture or operator can be viewed instantly. Experience says many machine operators know where the problems lie in any given manufacturing process. When asked how to fix the problems, they will probably have the answer. However, it is difficult for them to determine when the problems begin creeping back into their process, so real-time feedback is critical to enable them to do their jobs.After installing a real-time data collection system to automate data collection and analysis, less money will be spent and part quality will improve. Some part suppliers begin using SPC to satisfy a customer’s requirements and soon find these techniques have advantages for everything they do.
Install a SPC data collection system that gathers the data and produces the necessary information. Even after a false start with SPC software, implementation should be attempted again. Tedious, repetitive tasks in data collection and reporting should be automated at each step for an effective quality program.
Tech tips
- Before computers, what little SPC that was done took a long time because measurements and charting were labor intensive.
- If SPC software can filter raw data into useable information, then one person can easily track 500 critical features.
- Real-time SPC software applications should communicate problems or possible future problems allowing process adjustments to be made before problems get worse.
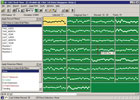
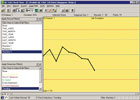
SPC Diagram with no Filter
Parts are examined on three different machines containing 30 features. Data needs to be separated for machine evaluation but the screen capture indicates no active filters. Source: Prolink Software Inc.
Parts are examined on three different machines containing 30 features. Data needs to be separated for machine evaluation but the screen capture indicates no active filters. Source: Prolink Software Inc.
Filtering facts
If the data is read by a real-time SPC program, it might look like the diagrams, “SPC Diagram With no Filter,” “Filter Part by Source” and “Filter Feature by Trend.”In the diagram “SPC Diagram With no Filter,” if the parts are manufactured on three different machines containing 30 features, separating the data by machine number indicates how each machine is running. The plot’s left edge has two filtering options that enable filtering by parts-records-and by feature. This diagram indicates no filters active.
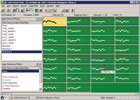
Filter Part by Source
Clicking on the machine 3 filter reduces the data to parts made on machine 3. This single click highlights part condition and gives immediate feedback of the machine’s condition. Source: Prolink Software Inc.
Clicking on the machine 3 filter reduces the data to parts made on machine 3. This single click highlights part condition and gives immediate feedback of the machine’s condition. Source: Prolink Software Inc.
The diagram “Filter Feature by Trend” shows that clicking on the Trending filter reduces the number of plots to only those containing trends being monitored. In this example, a low Cpk Trend was previously setup. The trend detection is set to watch for all features having a Cpk less than 1.33. The clutter of 30-plots is reduced to the one plot made on machine 3.
Filter Feature by Trend
Clicking on the Trending filter reduces the number of plots to only those containing trends being monitored. The trend detection is set to watch for all features having a Cpk less than 1.33. Source: Prolink Software Inc.
Clicking on the Trending filter reduces the number of plots to only those containing trends being monitored. The trend detection is set to watch for all features having a Cpk less than 1.33. Source: Prolink Software Inc.