Source: Instron
The need to ensure the repeatability and reliability of mechanical test results between individual testing systems, whether those systems are located in the same lab or different labs, or a comparison is being made between multiple suppliers, has recently surfaced as a critical concern throughout every industry. This is not surprising since product quality is critical and quality assurance depends on the ability of testing systems to provide accurate results.
Further, as many industries expand R&D and manufacturing operations into different parts of the world, data comparisons have become increasingly more important and complex.
Gage repeatability and reproducibility (GR&R) is a type of statistical analysis that is often performed by quality and product engineers as a method of testing equipment validation and verification. However, in cases where GR&R values are higher than expected, it is necessary to investigate and resolve, or at least minimize, sources of variation.
A nondestructive GR&R using a single controlled specimen is a good way to evaluate a testing system’s basic functionality. If the testing system is not able to successfully pass the nondestructive study, with results under 10%, it will not be possible to get acceptable destructive GR&R results. Source: Instron
Overview of GR&R
A GR&R study is a thorough investigation that provides a statistical approximation of the variation and percent of process variation for a test measurement system. Such studies are recommended by the Automotive Industry Action Group (AIAG), Six Sigma and ISO 9000 quality plans, and suggest that quantification of the repeatability and reproducibility of a testing system is required in order to determine how much of the observed variability is a product of the testing system versus part-to-part variation or process changes.The term repeatability defines how well the system can produce a known result over multiple tests. Reproducibility is the ability of another operator to produce the same results from similar parts with the same level of consistency. The output of a GR&R study is a quantitative result by which a testing system can be measured.
Statistical norms for GR&R values fall under three different categories. A GR&R value less than 10% is ideal for most measurement systems. This value suggests that the variability in the testing system is negligible and the results can be used to identify variability between parts or differences in production processes. A GR&R value between 10% and 30% suggests that the variability in the system is not negligible but may be acceptable for evaluating part variability. The performance of the testing system should be evaluated for areas of improvement to decrease inconsistencies. Finally, a GR&R value greater than 30% suggests that the error in the system is too great and will prevent differentiation between system error and part variation.
In many quality assurance labs, the purpose of mechanical testing is to ensure that products meet or exceed specifications, to identify changes in process that affect the critical part specifications and to evaluate the consistencies of those processes for reducing part variation. However, there is a danger in using GR&R exclusively as a methodology for evaluating a mechanical testing system.
GR&R does not address accuracy. It is possible to have very low GR&R values and test results that are wrong and not truly representative of the material or the product tested. The ability of a testing system to provide accurate results depends not only on the quality of the testing system, but also on errors that can be introduced into the system.
A fishbone diagram shows the major categories by which a testing system should be evaluated for error sources that can affect both the accuracy of a testing process and the ability of the gage to produce repeatable and reliable results. The major categories include the following: test method, measurement, operator, material, machine and environment. Within these major categories are subcategory sources of error that must be specifically addressed. This is not an exhaustive list of error sources, but rather common sources that should be considered.
When trying to determine and understand errors in mechanical testing results, one must examine the testing system in both a qualitative, physical manner and a quantitative manner. For the former, all elements of the fishbone diagram must be considered and evaluated. For the latter, results must be calculated and analyzed typically through a GR&R study.
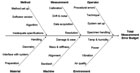
Fishbone diagrams show the major categories by which a testing system should be evaluated for error sources that can affect the accuracy of a testing system. Source: Instron
The Experiment
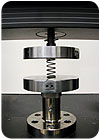
In order to demonstrate these theories in practice, a nondestructive study was conducted on four different materials testing systems from four different manufacturers. The specimens used were three different springs of varying stiffness. The study included both a qualitative examination to evaluate sources of potential error in each system and a quantitative analysis, nondestructive GR&R, to compare mean peak load values and determine a nondestructive GR&R value. The ultimate output was to provide recommendations for improving destructive test results.The first and most interesting point of discussion is the fact that in this relatively basic compression test, which was designed to over simplify the test parameters of the actual tests on sporting equipment, a test result range of 24 to 26-pounds was seen for each spring between systems. The differences in these mean values were the result of both poor GR&R, as well as sources of error in the testing systems. The following types of errors were uncovered and addressed.
Although speed accuracy may not be vitally important for testing springs, it is definitely a significant factor to consider when testing strain-sensitive materials. It is an important qualitative step to address before completing any comparative study between systems.
When looking for the load value at a specific point-for example 0.25 inches of compression-and there is no exact data point corresponding to that specified point, the software will interpolate the data or pick the next closest point. The more data points that are available, the more repeatable the system will report the correct value.
For example, one of the testing systems evaluated in this recent spring study did not use software, but rather a control panel, that required the operator to go through a series of repetitive manual steps for each test and manually record test results. It is likely that the increased number of steps and the reliance of the operator to record and translate the data to another system will increase the sources of error in reported data.
It is important to have very detailed operating procedures, regularly scheduled training for operators and test methodologies that limit the number of steps required by an operator to minimize the chance for error.
The sources of errors that were revealed and discussed in this study are just a sample of the types of errors that can be identified with both qualitative and quantitative evaluations of a materials testing system. Every testing system is unique, and test setups and configurations can vary widely.
In the case of a nondestructive test with a spring, the specimen is simplified to limit the errors that can complicate the analysis. When evaluating a destructive test with real test specimens, everything from the environment from which the materials originated, to how they were prepared, to the condition and environment in which they were tested needs to be considered.
A nondestructive GR&R using a single controlled specimen, such as the one described in this study, is a good way to evaluate a testing system’s basic functionality. If the testing system is not able to successfully pass the nondestructive study, with results under 10%, it will not be possible to get acceptable destructive GR&R results.
When conducting a destructive GR&R, the methodology described for identifying and resolving sources of error is critical to ensuring accurate, repeatable and reproducible results. Q


