
This chart shows the contours of response surface for rocket propellant burn rate as a function of fuel, oxidizer and binder. This is from a mixture experiment described by Myers and Montgomery in “Response Surface Methodology: Process and Product Optimization Using Designed Experiments, 2nd edition,” Wiley, 2002. Source: StatPoint Technologies Inc.
Anyone who has been exposed to the fundamental concepts of Six Sigma knows the importance of the role statistical methods play in quantifying improvements in process quality. Inherent to the name is the concept that quality is related to variability, because the Greek letter sigma is the standard statistical notation used to represent the standard deviation of a probability distribution. Whether the variable of interest is the strength of a manufactured item or the waiting time at an ATM, quantification of variability is fundamental to the assessment of system quality. That job is usually delegated to a statistical package, of which there are many.
There are some important criteria that should be considered when selecting a statistical software package to use in Six Sigma programs. Choosing the right software package has a lot to do with the eventual success or failure of the Six Sigma initiative. If the wrong choice is made, operators will put the software aside after their training is finished and go back to business as usual.
Criterion 1: Background of Targeted Operators
Statistical software packages vary greatly in their assumptions about the operator’s background in mathematics and statistics. With some programs, operators without several courses in basic and advanced statistical methods will find it difficult to: (a) select the proper procedures for their particular data, and (b) interpret the statistical results after they have been calculated. Other programs provide tools to guide operators in selecting the proper methods, often through some type of wizard. Online statistical “advisors” then interpret the numerical results in simple language that does not assume the operator remembers everything they may have learned in their statistics classes.When selecting a statistical package, be sure to ask:
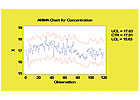
An ARIMA control chart is designed for monitoring data with a high sampling frequency. Such data violate the assumption of independence that is necessary when using a standard Shewhart chart. Source: StatPoint Technologies Inc.
Criterion 2: Type of Data Commonly Analyzed
Each statistical package tends to have a specific emphasis. Some are oriented toward engineering and manufacturing applications. Others put a heavy emphasis on uses in basic research and development. Still others are geared toward applications in the service industries. Because the type of data collected varies from one area to another, software packages tend to emphasize procedures for the type of data that the operators most frequently encounter.As an example, engineers tend to deal with two types of data: measurement data, such as tensile strength, and count data, such as numbers of defects. Operators in the service industries often deal with survey data. In research and development, there is a heavy emphasis on designed experiments. Amongst those in the financial and business communities, time series analysis and forecasting are frequently used.
The software’s ability to deal with unusual data features that are expected to be encountered should also be evaluated. While all statistical packages include routines to handle data that is normally and independently distributed, packages vary quite a bit in their capabilities to handle data that do not meet the standard assumptions. Ask whether there are procedures to fit regression models when the data are discrete counts rather than continuous measurements. Are there procedures to handle censored data that might result from a measurement system with a lower limit of detection? Can the control charts handle data with a high sampling frequency, making the assumption of independence between successive data values invalid? If a manufacturer expects to encounter very small or very large datasets, for example, the program must have procedures to handle such applications.
When selecting a statistical package, be sure to ask:
Criterion 3: Exploratory Data Analysis or Repetitive Data Processing
John Tukey, a famous statistician, wrote a textbook many years ago titled “Exploratory Data Analysis.” Tukey presented many techniques he had developed that were designed to help individuals explore their data. With the advent of the PC, statistical packages were developed with similar goals of enabling an analyst sitting at a keyboard to try many different ways of examining his data in an effort to extract whatever information it held.This was in sharp contrast to traditional programs, which assumed that operators would develop a set of analyses that would later be repeated on many different datasets. Whereas programs developed for exploratory data analysis tend to function through dialog boxes and windows that are hot-linked to the data in other windows and instantly update if that data change, the more traditional packages rely on having a language in which programs can be developed, saved and later executed.
With the advent of Web services, more analyses are being dynamically linked to data sources. Time series forecasts, capability indices, Pareto charts and the like can be placed on a Web page and made to change whenever new data become available.
When selecting a statistical software package, be sure to ask:

The ability to view information on a mobile device, such as this stability regression curve viewed using a Web browser, can be of great benefit to manufacturers. Source: StatPoint Technologies Inc.
Criterion 4: Accessibility of Statistical Results
After statistical analyses have been completed, the results need to be shared. Unless licenses will be purchased for everyone in the organization, this means that output needs to be transferred to other formats, such as PDF files, PowerPoint slides and Web pages that can be accessed from any Web browser. If companies frequently deal with colleagues in other countries, a package that makes it easy to translate the statistical results into other languages is a good option.When selecting a statistical package, be sure to ask:
There are a large number of programs that can be used to perform the statistical calculations required in Six Sigma. However, not all programs are designed to support operators who do not do statistics every day. The type of guidance and advice built into packages that are designed for practitioners rather than statisticians and the ease of sharing those results can be the difference between a Six Sigma program that achieves real success and one that falls short. Q
Quality Online
For more information on Six Sigma Software, visit www.qualitymag.com to read these articles:-
“Accelerating Six Sigma Rollout”
-
“Digital Solutions Achieve Six Sigma”
- “Six Sigma Software Generates Improvements”