
How can cost be reduced without impacting quality and delivery? Whether you work in a small business or a major corporation, the answer is of timely importance and can make the difference between maintaining-or losing-marketshare. An efficiency and effectiveness technique known as design of experiments (DOE) can benefit from modern enhancements-particularly related to cost.
DOE techniques have been around since the early 1900s. Amazon.com, alone, lists more than 200 publications on the topic. Just going from “one-factor-at-a time” testing strategies or “best technical guess” strategies to simple DOEs can be a large benefit to manufacturers.
DOE is a proactive testing technique where one or more input variables (factors) are explored at two or more settings (levels) in order to determine the change that takes place in one or more output variables (responses). Terms to remember include: factors, levels and responses.
It generally costs money to conduct tests and measure the resultant responses. Because of the cost involved, the larger the experiment, the greater the cost and time associated with the initiative. For example, the number of unique trials in a designed experiment is 2k, if two settings are explored for each factor and k is the number of factors. The number of runs in a two-factor, two-level DOE would be 22 = 4 trials. For five factors at two levels the number of trials is 25 =32.
Full-factorial designs at two levels are 2k DOEs. There are other classical DOE types that are more efficient than full-factorials, such as fractional-factorials, central-composite and Taguchi arrays-but the discussion of these other types goes beyond the scope of this article.
Even with these more efficient classical design types, the number of experimental trials in a DOE can be substantial. Many professionals who conduct industrial designed experiments never get beyond simple, two-level, full-factorial designs. Depending on cost and time, this can present a resource overload to the experimenter. If a team is in this position, it is time to consider additional enhancements to the DOE.
One relatively modern DOE enhancement is commonly referred to as computer-generated experiments. A popular type of computer-generated design experiment is D-optimal.
The Question
What if one took the data from a client’s previously conducted full-factorial designed experiment, set up a computer-generated D-optimal design, which generally has far fewer runs than a full-factorial design, extracted the relevant runs and then completed the analysis showing the software the data for the D-optimal design only? Would the analysis obtained from the D-optimal subset be much the same or would the analysis be greatly different from the full-factorial dataset analysis? If the results were much the same, organizations could save substantial resources by using D-optimal designs.The answer to this question is case dependent. However, by using the right assumptions, the answer is that results from D-optimal designs can be surprisingly close to the results from the full-factorial design-saving time and money.
Computer-Generated Design
Every software package that supports computer-generated designs has a different protocol, but they all want to know the following information:- How many levels need to be studied for each factor (two levels for linear relationships, three or more for more complex relationships)?
- Which factors are known to interact, relative to each response? Previously conducted experiments on similar processes can help answer this question. One approach is to study just two-factor linear interactions.
To get started, follow these suggestions:
- For screening experiments, look at a subset that studies only main effects and no interactions. The main effects plot may be useful-any predictions, manifested by the contour plot or 3-D, are likely to be poor.
- If the initial experimental objective was to do characterization or build a mathematical model, be sure and set up the D-optimal design to allow for the estimation of factor effects-linear effects if the original design has two levels, quadratic if the original design has three or more levels-and two-factor interactions. Many resources exist to help start experimenting with D-optimal designs.
Quality Online
For more information on design of experiments, visit www.qualitymag.com to read the following articles:“10 Steps to Optimal Production”
“DOE Eliminates Defects”
Main effects plot from full-factorial experiment.
Using D-Optimal: Example 1
Several years ago, a semiconductor client wanted to optimize the chemical mechanical planarization process and had conducted a full-factorial design. The experimental design had six factors at two levels, or 64 runs in the design with two replicates per run for a total of 128 data points.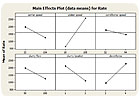
Main effects plot from D-optimal design.
On the main effects plots from the results of the full-factorial experiment and D-optimal subset, factor “B” appears to be the most important factor and the best level for each factor appears to be the same for both the full-factorial and D-optimal analysis.
For all practical purposes, the results ended up the same in this case. Since it cost the company approximately $1,000 to run each sample, a substantial amount of resources could have been saved if the team had used the D-optimal approach.

Example 2
What about a more complex experiment in which the experimenter needs to characterize multiple responses over an experimental region? In this example, the client was developing an automotive air bag deployment subsystem. The goal was to perform a characterization of the technology.The factors in the study include: orifice diameter, gas weight, propellant type and propellant weight. Each of the four factors was studied at two levels. The experiment had three different responses that were points on a time/ pressure profile curve.
The first response was referred to as time to first pressure. This was the amount of time that transpired before pressure was being sensed in the subsystem. For time to first pressure, a smaller value was considered to be better. The criteria were: less than 2 is “great,” and less than 3 is “acceptable.”
The second response to be studied was time to 90% of maximum pressure. For this response, a specification of 9 ±1 was desired. The third response studied was maximum pressure obtained by the subsystem and the specification for this response was 120 ±10.
The client chose to conduct a four-factor, two-level full-factorial designed experiment (16 runs) with three replicates per run. The team wanted to study linear factor effects and possible interactions. A total of 48 samples were taken for the three responses. Again, experimentation was expensive and each sample cost approximately $5,000.
Desirability functions were used to determine the best trade-off for the three responses. They have become popular in the past few years for multiple response optimization. Most DOE software packages now support desirability functions.
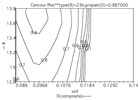
The contour of desirability from the D-optimal subset is shown:

Both analysis approaches-using data from the full-factorial and data from the D-optimal subset-provided almost the same conclusion in terms of best setting for all of the four factors so as to reach the best simultaneous trade-off for the three responses being studied.