
Material contamination by micron-range-size particles has become a focus of modern quality assurance. Initially, it was the pharmaceutical and semiconductor industries that were occupied with particulate contamination in this range. However, as the functional density of parts and components has increased and expectations for production sequences and quality have grown, this topic also has caught the eye of the automotive and aerospace industries, along with their suppliers. Fierce global competition, along with increasingly rigorous national, international (such as the International Organization for Standardization, or ISO) and company standards, have helped make examining for and eliminating particulate contamination a vital step in the manufacturing process.
In principle, nearly every production process and every manufactured product has specified cleanliness requirements. Solid particles in oils or fuels can damage motor components or hydraulic and lubrication systems. The production of precision parts and products in fine mechanical and micromechanical ranges is governed by stringent requirements regarding permissible levels of residue contamination. Such systems are typically used in sensitive areas of the medical device, aerospace and automotive industries. Damage caused by residual particulates can have catastrophic consequences, and in extreme cases, could even lead to total system breakdown.
Filter residue analysis is an essential part of analyzing cleanliness for liquids and high-precision parts. Detecting, visualizing, identifying and reporting on particles found in automotive and aerospace inspection filters help engineers ascertain contamination present in lubricants, hydraulic fluids, fuels and diesel emissions, and also is useful for monitoring cleanliness in engine blocks, transmissions, camshafts, crankshafts and other parts, which in turn affects the efficiency and durability of final products.
Pixel resolution of the analysis image.
Microscopic Residue Analysis
Microscope-based residue analysis helps determine the size of particulate contamination down to the micron level. Particles are quantified and then classified in compliance with relevant standards. The analysis usually includes three steps:- The object is cleansed with a rinsing fluid in compliance with a predefined standard.
- The rinsing fluid is filtered and any retained particulates are visible atop the filter surface.
- The filter is placed underneath an optical microscope for automatic particle quantification and analysis.
Manufacturers typically require many or all of the following when working with automated filter inspection systems:
- Adherence to international, national and/or company standards.
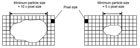
- The ability to accurately count and reconstruct images of particles that exceed the size of individual image frames. Such particles must not be truncated or counted repeatedly.
- Automatic focusing at each image frame to compensate for variations in filter height or tilt.
- Data analysis flexibility so technicians can revise, modify or reclassify results.
- Accurate discrimination of reflecting particles vs. non-reflecting ones, plus fibers vs. particles.
- Automatic archiving of relevant data and generation of clear, useful reports based on predefined company templates.
- Speed, efficiency and intuitive operation.

To distinguish between reflecting and non-reflecting particles, polarized illumination may be required. Typically, one scan is performed with the polarizer in the open position, and a second scan is performed with the polarizers perpendicular to each other, or cross-pol. When the process requires automatic scanning of multiple filters simultaneously, a microscope with an extended throat-depth, such as a dedicated semiconductor microscope, may be considered. Source: Olympus America Inc.
How Automated Systems Work
In most modern microscope-based image analysis systems, system settings are defined once upon initial system configuration by an administrator or advanced operator; these are typically password protected to ensure tamper resistance. Such presets may include the area definition of the filter to be scanned, software training for particle detection, and thresholds for image analysis, database fields and report template information. After such parameters have been defined, the operator secures the filter into the integrated holder and starts the scanning process.The motorized microscope scanning stage automatically positions the filter underneath the microscope so that images are acquired at every frame over the entire area of the filter. To maximize efficiency, particles are typically detected on-the-fly.
Should large particles or fibers exceed a single image frame, they are “stitched” together and reconstructed automatically so they are counted only once. Although the use of a filter holder can minimize variations in sample flatness, some systems also offer an integrated tilt-compensation, or “predictive focus” algorithm, which extrapolates the predefined tilt, either linearly or non-linearly, during the scan.
In addition, at high magnifications where the microscope depth of field is minimal, image analysis solutions may offer additional options to ensure proper focus. Some of the more sophisticated solutions offer a highly accurate laser-based autofocus mechanism to achieve focus quickly and precisely at each frame.
Using an automated microscope filter inspection system, a complete scan of a 47 millimeter filter can be accomplished in as little as three minutes. After the scan is complete, spreadsheets, histograms and reports can be generated automatically based on predefined standards and templates. The operator can address any discrepancies using a built-in feature that allows him or her to revise findings interactively. The software also may archive results into a database automatically, eliminating the need for the operator to save results manually. Further, operators can perform simple or complex queries on all relevant data.
Choose the Correct Microscope
Among myriad microscope configurations available, one parameter is most critical: the minimum particle size that can be detected.In addition, there are specific guidelines that must be adhered to regarding industry, government, professional society and corporate standards. For instance, ISO 16232 (5.2.2.1.2) says:
The magnification, resolution and depth of field are selected according to the optical lens. The key parameter for a precise measurement is the optical resolution (and not the magnification) of the selected lens. This value is dependent on the light wavelength and the numerical aperture of the lens. The optical resolution of the selected lens should be equal to or less than ¹⁄₁₀ of the smallest particle. In the case of particles below 20 µm, the standard accepts that the resolution is less than or equal to ¹⁄₅ of the smallest particle size.
To calculate the correct objective lens to use, here is a simple example. Let’s say particles as small as 5 micrometers (µm) must be detected in compliance with ISO 16232. The Rayleigh criterion formula can be used to calculate resolution (Resolution = .61 * l / NAobj) Using a typical light wavelength of 550 nm, the resolution of one semi-apochromatic objective lens, for instance, is 0.75 µm. Since ISO 16232 states that the objective lens must resolve ¹⁄₅ of the smallest particle, or ¹⁄₅ of 5 µm (1 µm), this lens is acceptable.
Some operators whose particles are 25 µm in size or greater can select a high-resolution stereo microscope for filter inspection, since these instruments usually offer a larger field of view and depth of field, and typically cost less than upright microscopes. It is important to note that stereomicroscopes must have a repeatable magnification detent to assure repeatable results.
To distinguish between reflecting and nonreflecting particles, polarized illumination may be required. Typically, one scan is performed with the polarizer in the open position, and a second scan is performed with the polarizers perpendicular to each other, or cross-pol. When the process requires automatic scanning of multiple filters simultaneously, a microscope with an extended throat-depth, such as a dedicated semiconductor microscope, may be considered.
Selecting the Camera
Which camera is best for automatic residue analysis? For highly accurate and fast residue analysis, key questions to consider include:- What digital resolution is required?
- Is color or gray-scale imaging an appropriate choice?
- What refresh rate (speed) can be achieved?
The pixel resolution (µm / pixel) shall be ≤ ¹⁄₁₀ of the smallest particle size to be measured, or ≤ ¹⁄₅ for smaller particles (defined as below 20 µm).
Using the above example of detecting 5 µm particles using a 20X objective lens, we can extend the example to calculate the calibrated camera digital pixel resolution. Take for instance, a high-speed monochrome or color camera with a pixel size of 6.45 µm. If the operator uses a 1.0X camera adapter, both cameras’ digital pixel resolution is 0.32 µm (6.45 µm ÷ 20). Since pixel resolution falls beneath the benchmark requirement of ¹⁄₅ of the smallest particle (¹⁄₅ of 5 µm, or 1 µm), both of these cameras meet the ISO 16232 requirement when using a 20X objective lens.
As contamination has become a focus of modern quality assurance, many manufacturers have evolved from manually counting particles to the adaptation of a fully automated turnkey microscope-based system. With various solutions available, operators should determine if their system will produce results in compliance with appropriate international, national or company standards. In addition, systems should provide speed, flexibility and repeatable data to meet individual process and operational requirements.Q
Tech Tips
- In principle, nearly every production process and every manufactured product has specified cleanliness requirements.
- Microscope-based residue analysis helps determine the size of particulate contamination down to the micron level.
- When it comes to the microscope configurations available, the most critical parameter is the minimum particle size that can be detected.