Anyone who has faced a production problem with a need to solve it by using production data can relate to the notion of a brain teaser. The brain teasers presented here are based on real-world situations encountered by workers in manufacturing environments. The brain teasers have three parts: (1) the situation, (2) available data or other supporting information and (3) questions that various workers need answered for continual improvement. Recommended solutions follow in the next issue and on the Web at Quality Online (www.qualitymag.com).
Situation
Colin is the expert on measurement studies for a company that makes electrical components. For two critical product measurements-resistance and watts-product specifications are expressed as a percent of the target value for the particular component. Colin records the data for the measurement study as a percent of the nominal for the reference standards used. The current specifications for resistance and watts are ±5% of the nominal for the characteristic on all components. However, one major customer has indicated that the specifications for new components will be cut in half to ±2.5% of nominal. Colin is concerned that the measurement devices his company uses have too much variation to give reliable product data to ensure that the products meet current specifications. As for the future product with specifications that are half the current ones, Colin feels that the measurement devices must be replaced because of the amount of variation.
Available data
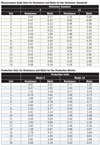
Data from a recent measurement study are summarized in the table, “Measurement Study Data for Resistance and Watts for Two Reference Standards.” Production process data are summarized in the table “Production Data for Resistance and Watts for Two Production Models.” Use these data to answer the questions.
Questions
- 1. What is the behavior of the two measurement standards for resistance and watts? What is the behavior of the two production models for resistance and watts?
2. Based on the production data provided, what is the capability of production models 4 and 15 for resistance and watts?
3. Using the variation from the measurement study and the variation from the production process, determine the variation of the production process for the two production models.
4. If the new specifications were applied to the current production models, what is the capability of resistance and watts?
Answers to July Brain Teaser
Joyce works in the IT department of a chemical company. She is working with process engineers to set up the data collection for process temperatures that will be analyzed on process behavior charts. There are eight thermocouples and the engineers want data every 30 seconds. Joyce thinks that this will be a lot of data, but she does not know enough about data collection to question the engineers.
Q: At first glance, do these data appear to have sufficient detail to determine if these thermocouples meet the temperature specifications?
A: To check for sufficient detail in data, refer to the moving range or range portion of a process behavior chart. Determine the measurement unit or resolution of the data and then count the number of possible values for the range that are inside the upper control limit (UCL) of the moving range or range chart. For these data, the appropriate chart is the moving range chart. A quick check of the moving range chart for each thermocouple shows that the UCL is less than 1.0 and the resolution of the data values is 1. For both thermocouples only one value for moving ranges, the value of zero, falls inside the upper control limit. See the charts, “Thermocouple One” and “Thermocouple Five.” With moving ranges, a minimum of four possible values is required to ensure the data have sufficient detail.
Q: Using these data, what is the process behavior of these two thermocouples?
A: The process behavior charts that revealed the lack of detail in the data values are not reliable to determine process behavior for these thermocouples. This lack of detail in the data leads to an underestimate of the standard deviation for the process, and as a consequence, the control limits on the chart are artificially tight. Those points that are outside the limits may be false signals of exceptional variation.
Q: How can one determine if the frequency and level of detail in the data are appropriate for this process?
A: There is some trial and error to determine the best frequency and level of detail in the data. One approach is to leave the data at the current resolution and plot every 10th value or every 100th value to see if the resolution continues to have an impact on the calculations of the chart. There needs to be at least four possible values for the moving ranges inside the UCL to ensure enough detail in the data. Another approach is to record the temperatures to one tenth of a degree and then make a process behavior chart.
Q: How does it help the engineers to record data every 30 seconds?
A: Recording data so often may appear to be helpful, but it is unnecessary and costly. Frequent recording of data values often causes overreaction to a single number when the routine variation is not clearly understood. When data values are the same for a long sequence, the standard deviation for the process often will be underestimated. Underestimating the standard deviation for the process leads to an expectation that the process has a greater capability potential than it really does. The routine variation for the process is greater than indicated by the calculations.
