Anyone who has faced a production problem with a need to solve it by using production data can relate to the notion of a brain teaser. The brain teasers presented here are based on real-world situations encountered by workers in manufacturing environments. The brain teasers have three parts: (1) the situation, (2) available data or other supporting information and (3) questions that various workers need answered for continual improvement.
Situation
Emily is the manager for customer service for an aftermarket automobile parts company. Her company's products are sold through autoparts outlets and are often installed by the car owner rather than a service center. All parts are guaranteed to work correctly in the owner's vehicle regardless of who does the installation, but many parts are returned with the comment, "Does not work." A year-to-date executive summary of returns with data through February has projected a 25% increase in returns for the year. The company president is very concerned and has asked Emily to analyze data about the number and condition of returned parts for an upcoming meeting.

Available Data
p> Monthly summary data are available for total returns with details by parts and customer comments. Data for the past 14 months are summarized in the table, "Customer Return Data."
Questions
1. Do these data support the assertion from the executive summary that Emily's company can expect a 25% increase in returns?
2. How does an analysis of the behavior of the returns data support the projection of a 25% increase?
3. What percentage of total production is being returned? Is this a predictable process?
4. What percentage of returned parts is really good? Is this a predictable process?
Answers to April Brain Teaser
p> Kirk, a supervisor in a company that makes injection molded plastic containers for the cosmetic industry, has been assigned to a lean project to reduce the time between color changes for the containers. For the production line with only one container size, Kirk and his team used a trial-and-error method with relatively quick results. However, for the production line with several sizes and shapes, Kirk called on a Six Sigma Black Belt to help with a designed experiment to determine when to make color changes foreach situation.
Q: What is the variation in the number of rounds until the new color appears for this production line?
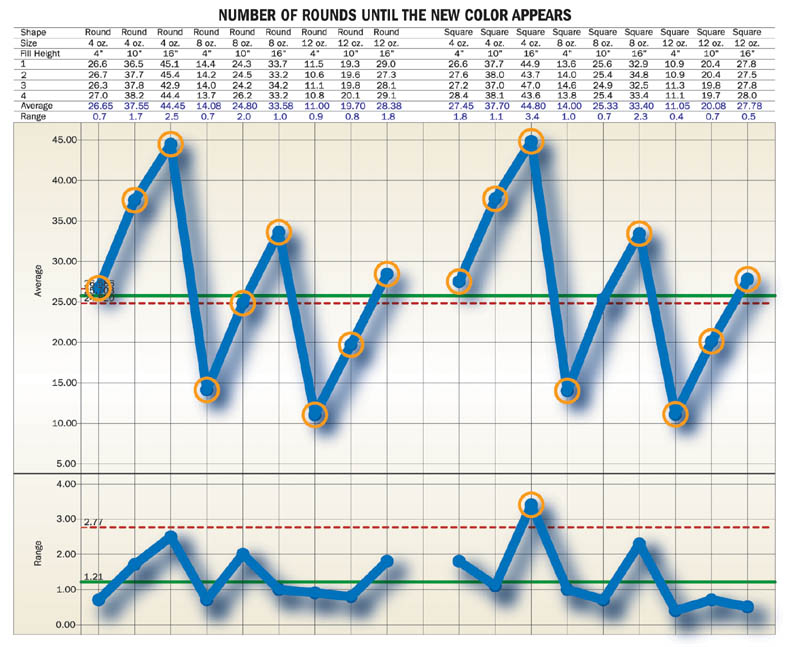
A: With three container sizes, two shapes and three different marking levels on the hopper, there are 18 possible situations to evaluate the variation in number of rounds until the new color appears. Before calculating a single value, such as the pooled standard deviation based on the 18 combinations, it would be wise to determine if all of these have the same amount of variation. A range chart of these 18 subgroups shows one subgroup has a range outside the upper limit. See the average and range chart, "Number of Rounds Until the New Color Appears." This higher range should be investigated to see if it persists for this combination of factors. Meanwhile, what is the best estimate to use for the standard deviation of the number of rounds before the new color appears? Using all experimental combinations, the average range divided by d2 = 0.65 and the pooled standard deviation is 0.702. If the one combination were removed, these values would be 0.59 and 0.61 respectively. Kirk decided to use the pooled standard deviation based on all combinations to be most conservative in making the color changes.
Q: Which factors-feed hopper height, container size or container shape-have an effect on the number of rounds until the color appears?
A: Feed hopper height and container size have a large effect on the number of rounds until the color appears. The difference in container shape does not impact the number of rounds until the color appears.
Q: Set up a table for Kirk to use when introducing a new color at any of the three hopper heights for any of the three sizes and two shapes, so that a minimum number of containers will be impacted.
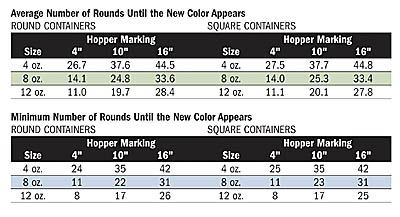
A: The average number of rounds for each combination in the experiment is given in the table "Average Number of Rounds Until the New Color Appears." These average values together minus 3 times the pooled standard deviation of 0.702 were used to determine the minimum number of rounds remaining for the current color. To ensure the current color production quantity is met, these minimums were rounded down to a whole number. For example, in the case of 12-ounce round containers with the new color at the 4-inch mark on the hopper, the average number of rounds until the new color appears is 11. The minimum is calculated as 11 - 3(0.702) = 8.9 rounds. Rounding this number down gives a value in the table of 8 rounds to complete a production run and to be assured that the new color will not come in too soon. Kirk may find over time that these minimums may change slightly depending on the variation in the process.
Q: How many rounds will be involved in the transition?
A: Using the pooled standard deviation of 0.702 based on all 18 combinations used in the experiment (including the combination of 12-ounce square containers with the new color at a height of 16 inches on the feed hopper), there will be 4 X 0.702 = 2.808 or approximately 3 rounds in the transition for each combination of size and hopper fill height marking between 90% and 98% of the time. The 90% to 98% of the time comes from the empirical rule which includes a wide range of possible distributions for the data. In actual practice Kirk may not experience this much transition. Kirk might also approach marketing to see if there is a potential customer for multi-color containers.
Dr. Sophronia Ward is a continual improvement specialist and Six Sigma Senior Master Black Belt and coach. Brain teasers are now incorporated in the new training programs, Six Sigma Training for Champions, Black Belts and Green Belts, offered by Dr. Ward and her associates at Pinnacle Partners Inc. For more information, call (865) 482-1362 or visit www.pinnaclepartnersinc.com.
