Anyone who has faced a production problem with a need to solve it by using production data can relate to the notion of a brain teaser. The brain teasers presented here are based on real-world situations encountered by workers in manufacturing environments. The brain teasers have three parts: (1) the situation, (2) available data or other supporting information, and (3) questions that various workers need answered for continual improvement. Recommended solutions follow in the next issue and on the Web at Quality Online (www.qualitymag.com).
Situation
Xavier has just been promoted to quality manager at a glass container manufacturing plant. In this capacity, he reports values for key characteristics of the glass containers during production meetings. Based on the reported values, those in attendance will determine what required actions need to be taken on the process. One critical characteristic is the internal burst pressure of the glass containers because they will be filled with a carbonated beverage. The previous quality manager reported only one number for pressure at the meetings. As long as this number was between 380 and 400, the rest of the managers appeared to accept that the pressure was sufficiently high to prevent breakage with contents under pressure. Xavier wants to determine what data to report and if a single number is sufficient to know if pressure will meet customer requirements.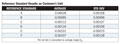
Available Data
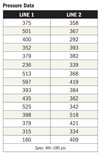
Pressure data are available for all production lines and each different type of container. Xavier decided to start with two production lines and one type of container to determine what to report at production meetings. These data are summarized in the table, “Pressure Data.” The pressure specification for this type of container is a minimum of 180 psi.Questions
1. If Xavier decides to report the average pressure value at the production meeting, will one number satisfy both production lines?2. Do the current data indicate that the pressure values are all in spec?
3. What should Xavier report at the production meeting in order to give complete information about pressure so the other managers can make appropriate decisions?
Answers to November Brain Teaser
As marketing director for a company that makes vision inspection equipment to measure product characteristics without physically touching them, Darlene is very sensitive to customer feedback. One customer makes disks that are soft and subject to distortion with mechanical measuring devices. This customer is complaining that the vision inspection is not performing as well as in the past. Darlene’s engineers suspect that something in the customer’s environment is the cause, and they have collected data on current production units and the customer’s unit with six reference standards.Q: How can these data be analyzed to determine if there are errors in the equipment at the customer’s location?
A:Use the data on the 10 current production units and make process behavior charts (individuals and range) for each reference standard to see if there is any bias and to compare the standard deviations for the reference standards. These standard deviations will include measurement variation plus production unit variation. It is preferable to subtract the reference standard value from each measurement and use the deviation values in the process behavior charts.
For the measurements taken on the customer’s unit, construct separate individuals and moving range charts for the 10 data values using each reference standard. Check for bias and compare the standard deviations. These standard deviations will reflect only measurement process variation.
Alternately, a two-way analysis of variance can be done using each set of data; however, this technique will not check for predictability of the data over time. Because each reference standard has a different value, use the deviations from the reference standard value to do the analysis.
Q: Does the visual inspection equipment at the customer’s location perform predictably for the diameter of the test units?
A:Yes, using individuals and moving range charts, all reference units show a predictable process on the average and the variation for the customer’s vision inspection unit. The reference standard results are given in the table, “Reference Standard Results on Customer’s Unit.”
Q: Are the average and variation for diameter the same for the customer’s visual inspection unit as for the production units at Darlene’s company that have not yet been shipped?
A:Using individuals and moving range charts, the production units at Darlene’s company also show a predictable behavior for the six reference standards. The standard deviations are larger because the variation includes measurement process variation plus the variation from unit to unit.
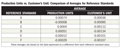
A comparison of the averages-using the deviations from the reference standard value-of the six reference standards from the 10 production units and from the customer’s unit shows that the customer’s unit has an overall average that is less than the overall average for the production units. See the averages in the table, “Production Units vs. Customer’s Unit: Comparison of Averages for Reference Standards.”
Because the process behavior charts show a predictable process and the standard deviations are comparable, combining the data for the customer’s unit and testing the hypothesis that the mean deviation for the six reference standards is zero reveals that the customer’s unit has an average that is significantly less than zero. This test result indicates a bias in the customer’s unit. The amount of bias is small, but could account for the perception that the unit “is not performing as well as it did in the past.”
Q: If the process engineers find that the cause of any errors come from the customer’s use of the inspection equipment, how should they communicate that information to the customer?
A:From the analyses of the data on production units and the customer’s unit, the process engineers have found a small, but statistically significant bias in the customer’s unit. The engineers need to share these results with the customer and tell them that while the bias is small, it could get worse over time. The customer needs to observe the ongoing use of the unit and continue to collect data from the reference values to detect possible further changes in the inspection unit’s performance. The small bias discovered so far could be from deterioration in the light source in the unit or some other component. Another possible explanation is the replacement of the light source or some maintenance activity might have led to the slight bias. The faster the discovery of the cause of the current bias, the better the machine will perform. Darlene’s engineers should agree to assist the customer as they monitor the behavior of the vision inspection unit to find the causes of bias or other changes in the equipment.
