
Image intensity along a caliper line (green line in image) is plotted in black and the differentiated image intensity is in red. Small intensity changes are removed by applying thresholds (green lines in plot) to the differentiated image intensity. Source: Teledyne Dalsa Inc.
Human and machine vision use an object’s edges to locate, identify and gage the object. This tutorial will give a better understanding of how edge detection-or finding and measuring edge positions-works in machine vision, where it can fail and what level of precision to expect.
In a digital image, object edges produce intensity changes over a few pixels of distance. When differentiating image intensity as a function of pixel distance, the rapid rate of change in intensity at edges generates large output values. One can then detect object edges by finding these large output values.
Intensity changes due to lighting variations are usually smaller and occur over longer distances in the image than edge intensity changes. Differentiating these changes gives smaller output values that can be filtered out by applying a threshold. By detecting edges, one can reliably locate and measure objects without having perfectly uniform lighting.
An object’s edges can be used as a model or template to search for other instances of the object. Edge-based search can be faster and more robust than search based on pixel intensities.

The top-most caliper line detects false edges (red + marks) due to texture. The bottom caliper line has been set to stop on the first edge found that is above threshold, thus ignoring texture inside the part. The plot shows the edge intensity in black, the digital difference curve in red, thresholds as green, horizontal lines, and found edge positions as blue, vertical lines. Source: Teledyne Dalsa Inc.
Computing Edges
Modern machine vision systems hide most details of the edge detection process in easy-to-use tools, such as search or outside calipers. An understanding of how edges detection works and its limitations can improve use of these tools.Digital images are discrete in space and intensity, so use digital difference operations rather than continuous differentiation to detect edges. For example, take the difference between successive intensity values along a caliper line. Difference operators can be represented as a vector or kernel values that multiply (weight) and sum pixel intensity values.
In linear algebra terms, this is a dot or inner product between a kernel vector and a vector of pixel values. For example, taking the difference between successive pixels is represented by a kernel of [-1, 1]. This means: take two successive pixels, multiply the left pixel by -1 and the right pixel by 1, and sum the results, so: output = (right pixel + (– left pixel)).
The kernel is moved along a caliper line and this weight-and-sum operation is performed at each pixel. This process is called convolution (it is actually correlation). One way to think of convolution is that the kernel is an intensity pattern that looks like an edge and slides along a line in the image. Where this pattern matches an edge, the output will be large values.
Here are three problems with detecting edges using convolution:
First, convolution runs out of pixels at each end of the caliper line. It cannot detect edges that are closer to the end of the caliper line than half the number of kernel elements. So make both ends of the caliper lines a bit longer than the maximum expected edge positions.
Secondly, the object should have a width as large as or larger than the size of the kernel used. This restriction is needed for subpixel resolution, discussed below. Avoid measures on thin lines.
Thirdly, digital differences amplify any changes in intensity, including changes due to noise and texture on the part. Edge detectors smooth pixel intensity values before digital differencing to reduce the effects of noise and texture. Because convolution is linear, smoothing and digital differencing can be combined in one kernel. For example, combining a [1, 1] smoothing kernel and a [-1, 1] digital difference kernel gives a kernel of [-1, 0, 1].
Even after smoothing, noise or texture can produce false edges. Noise gives small convolution values so a threshold-the same one used to suppress lighting variation-can remove it. Texture can give outputs too large to remove by a threshold.
Texture edges can sometimes be suppressed by setting the edge detection to avoid the textured area, for example, by stopping detection at the first above-threshold edge found or by picking the edge with the maximum value.
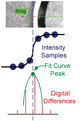
A dark-to-light edge (top) gives intensity samples (blue dots). A curve (green) is fit to the digital differences (red), and interpolated to find the peak (green) dot, which is the subpixel edge position. Source: Teledyne Dalsa Inc.
How Precise?
Suppose an outside caliper tool is used. The tool returns edge-to-edge distance measures with, apparently, 4 or 5 decimal places of resolution, say 87.17095. This apparently great resolution is mostly noise-the precision of the measurement is much less, perhaps 1⁄10 of a pixel distance. If one thinks about it, any fractional or subpixel precision seems impossible. With pixel values at discrete locations, how can one measure between these locations?If the edge intensity changes in less than one pixel then subpixel position cannot be measured. As the position of that step edge moves inside the pixel, different values show up but there is no reliable way to relate those values to edge position within the pixel.
Real object edges transition in intensity over some distance and the camera’s optics further smoothes or blurs edge intensity values over some distance. Both distribute information about the edge’s position over a number of pixels. To recover the subpixel edge position, model the distributed edge position samples and interpolate. For this to work, the smoothing or blurring must occur before the image is digitized.
The model assumes that edges are at the point of maximum intensity change, so it peaks in the intensity derivative. Typically there will not be an intensity sample right at the peak of the digital difference values. Therefore, fit a parabola to the digital difference values that are closest to the peak, and interpolate along that curve to find the peak.
To get subpixel position resolution, object edges that are smoothed by nature and the camera’s optics are needed. Assume that, on these smoothed edges, the point of maximum intensity change-a peak in the derivative-is the edge position. In the digitized image recover that peak position by fitting a curve to the digital difference values (samples) and interpolating.
The choice of lens and camera also effects precision and accuracy. Standard machine vision lenses-particularly short focal length lenses-significantly distort image distances. The vision system’s calibration can remove most of this distortion, but for high precision and accuracy use a lens designed for measurement, such as a telecentric lens. In theory, a lens that is too sharp will not smooth edge information over a number of pixels and so could decrease sub-pixel precision.
Use a camera designed for machine vision. Among other things, these cameras have no defective pixels, which can give false edges. More camera pixels can give better precision on object measurements. Subpixel precision is not a function of the number of pixels.
With a good lens, reasonable lighting and sharp object edges (but not too sharp), one can expect resolutions of ¼ to 1⁄25 of a pixel depending on how well the resulting edge intensity values match the subpixel model assumptions. Some vendors claim 1⁄100 of a pixel resolution or more, this maybe be with ideal conditions that are not likely on a manufacturing line. As with arms control, one should trust but verify these claims.
