
A minifocus source (around 1 mm) allows no magnification, whereas a microfocus source (1-5 µ) can be magnified to produce higher-resolution images.
Source: Nikon Metrology Inc.
Source: Nikon Metrology Inc.
Offer the term “metrology equipment” to a group of industrial or manufacturing engineers in a word-association test and it’s highly likely CMM (coordinate measuring machine) would be the response. Yet, unlike a probe-based measuring methodology, X-ray micro computed tomography (µCT) not only has the accuracy, resolution, speed and flexibility manufacturers require, it provides details and insight unattainable by other means (think porosity and density mapping, for example).
High-accuracy X-ray micro CT technology continues to evolve. Applications are diverse and growing across the automotive, aerospace, energy, medical, electronics and electronics packaging sectors, dealing with metals, exotic alloys, composites and single-crystal materials. Accompanying software tools enable the analysis of part volume against the CAD model, either via direct volume-to-CAD comparisons or through geometric dimensioning and tolerance measurements. And with price points low enough to make it competitive with other techniques, X-ray micro CT is ready for the metrology mainstream.
Better understanding the rules of X-ray micro CT not only opens the door to production cost savings and productivity improvement, but also knowing when to break them can provide even further process flexibility. Claims are made that CT is only appropriate for light metals, plastics or objects of limited size, when the reality is that such limitations may belong only to those making the claims. Better understanding the rules of CT certainly provides a better basis for what is possible with this technology.
The Basics
X-rays are at the short end of the electromagnetic spectrum with an average wavelength between 10-8 and 10-12 meters, around the size of water molecules, compared to radio waves with wavelengths that could span a soccer field. There are no radioactive sources in X-ray micro CT; rather electrons are produced from a hot filament similar to a light bulb and accelerated at high voltage, creating a beam of electrons reaching speeds up to 80 percent of the speed of light. The electron beam is focused by a magnetic lens onto a metal target, producing a spot typically between 1-5 µm in diameter. The sudden deceleration of the charged electrons when they hit the metal target produces 99.03 percent heat and 0.7 percent X-rays.These X-rays emanate from the region where the electron beam hits the target. The size of this spot is referred to as the X-ray spot size. In general, the higher the voltage applied, the more power is in the beam, and consequently, more power is transferred to the target. The more power on the target, the larger the X-ray spot size and the more X-ray power produced.
X-rays travel in a straight line, through the object being inspected, and onto a detector. The object will absorb some of the X-rays (denser objects absorbing more), leaving only a portion to reach the detector. At low X-ray energies (<60kV), differences of absorption along the X-ray path to the detector are detected and shown as a shadow image. At higher X-ray energies (60-225kV), absorption and scatter occurs. This scatter generally reduces contrast in the image. With X-ray energies above 225kV, scatter becomes an increasing problem for certain detectors. Above 225kV, scatter can be rejected from the detected signal by a linear detector, although throughput decreases (fewer images per hour). And at greater than 300-400kV, scatter is the dominant contrast mechanism, i.e. more X-rays leave the beam from scatter than from absorption.
Amorphous silicon flat-panel detectors have a fluorescent screen that converts the X-ray energy into light to form an image on an array of light-sensitive diodes. Electronics allow this image to be read by a computer. These panels can have pixel sizes over a wide range and sensitivities up to 16 bits (64k grey levels).
The sensitivity of the detector relates, in part, to the size of the X-ray source. A lot of typical high-power X-rays sources are minifocus, in the range of 1 mm across. This limits the resolution of images to that of the detector; a very fine detector is needed to get high resolution and no magnification is possible. Microfocus means the size of the X-ray source is only a few microns across (1 micron or 1µm is 1/1000th of one millimeter). With a microfocus source, a standard detector can be used and geometric magnification can be used to gain a higher-resolution image.
Generally, microfocus sources are only available up to 225kV, although some manufacturers produce 300, 320 and 450kV microfocus systems, whereas minifocus tubes go beyond 225kV.
The Rules
for good X-ray micro CT are as follows:· Penetrate the sample from all angles.
· Minimize noise in each projection image.
· Use filters to reduce beam hardening.
· Always use 360-degree rotation.
· Use the detector’s full dynamic range.
· Keep the object in the field of view.
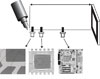
Combine the penetrating power of X-rays and the ever-increasing data-processing power of the computer and computed tomography is the result. The fundamental setup includes X-ray source, object being measured, and a detector. A rotating platform for the object being imaged helps comply with Rules 1, 4 and 6.
Thousands of digital images can be produced from a single sample and each two-dimensional pixel in each image contributes to a three-dimensional voxel as computer algorithms reconstruct 3-D volumes. For example, with 3,000 images, each voxel in the resulting billion or so is processed 3,000 times. The result is a 3-D volumetric map of the object, where each voxel is a 3-D cube with a discrete location (x,y,z) and a density (ρ). Not only is the external surface information known, such as with a 3-D point cloud from laser scanning, but internal surfaces and additional information about what is in between the surfaces from the fourth dimension (density) is provided. Furthermore, “slices” produced by the process and accompanying software can yield much information without destroying the part.
Image intensity, then, becomes the basis for measuring the sample. In CT, what’s being measured is the linear attenuation of the X-rays, or how much one unit of length of material reduces X-ray intensity.

Streak artifacts in this razor blade scan result from the different densities between blades and holder. Source: Nikon Metrology Inc.
Dealing With Artifacts
Unfortunately, not all CT scans result in perfect data. Imperfections (“artifacts”) can occur and can affect measurements considerably. Recall Rule 2, “Minimize noise in each projection image.” Noise can appear as speckles in slice images, but can be minimized by maximizing the X-ray dose.There is also non-linear detector noise in projection images that stays in the same position for all projection images. As images form, this noise is reconstructed as circular rings, i.e. “ring artifacts.” Noise in the reference images gives the worst ring artifacts because it is reused to correct each projection image and is, therefore, amplified. Noise in the black reference image is more significant than noise in the white reference image because the signal is less in the black image so the signal-to-noise ratio is also less.
Ring artifacts are stronger nearer the axis of rotation because fewer reference image pixels are used. They can be minimized by averaging many frames when collecting black and white reference images.
Beam hardening is the self-filtering of the X-rays by the sample, so the X-rays have a higher energy inside the sample and are, therefore, more penetrating. Because of this, the measured X-ray linear attenuation is lower inside the sample than at the edges, thus giving rise to beam-hardening, or “cupping” artifacts.
Beam hardening can be reduced by pre-filtering the X-ray beam (placing a filter over the output window of the X-ray source–Rule 3, “Use filters to correct beam hardening”). It can also be corrected for, to some extent, by using the beam-hardening correction filters in the CT software. This works best with single-material samples.
Rule 5 is “Use the full range of the detector.” Higher dynamic-range detectors (more bits) help detect small differences in intensity due to low-density materials, such as plastics, in the presence of high-density materials, such as metal.
Streak artifacts are caused by beam hardening or lack of penetration of the X-ray beam through the sample. Lack of penetration can be solved by increasing the X-ray energy (kV), unless, of course, you are at the maximum for the system.
Streak artifacts can be reduced by filtering the beam, applying a beam-hardening correction or by using a detector with a high dynamic range. Scattered radiation can be reduced by collimating the X-ray beam and the detector to detect only those X-rays that travel in a straight line from the source to the detector.
Breaking the Rules
Following the rules will give the best-possible CT results for full metrology purposes and is general good practice. But-if you need qualitative information (is a crack present or not, what is the sample’s porosity, how many densities are present, is an electrical connection made or broken) or the information needed will not be affected by the artifacts-then rules can be broken:· Rule 1: Penetrate the sample at all angles; Rule 6: Keep the object in the field of view
If the material not in view is relatively uniform in shape and homogeneous, then it will only add a small ring at the edge. Internal features will be easily visible and usable. This allows us to zoom in and see more detail. And if the feature being analyzed is near the center of the scan, or if the size of the feature is much larger than a single pixel, then the number of projections can be reduced to speed up the scan.
· Rule 2: Minimize the noise in each projection image
If time is pressing, reducing the noise in the black and white reference images will reduce the noise significantly without greatly increasing the length of the whole scan.
· Rule 4: Always take projections over 360 degrees
If the object has a very long path that is difficult to penetrate but is narrow so that the lack of penetration only occupies a few projections (< 10-12), then these projections can be replaced with a corrected image with the sample not present. This adds no attenuation and so doesn’t affect the reconstruction. It is advisable to take some extra projections to compensate.
· Rule 5: Use the whole dynamic range of the detector
When inspecting very low density specimens, very low energy X-rays are used to give good contrast in the images. To fill the dynamic range requires long exposures. Halving the exposure only loses one bit of information but saves a lot of time
The rules of CT come out of the theory of CT reconstruction. Following the rules means you will most likely get the best-quality CT data. But sometimes breaking the rules can save you lots of time without compromising image quality too much.
The metrology applications involving X-ray micro CT are varied and growing. They include inspecting for intersecting holes in diesel engines; fit-and-finish requirements for drink bottle tips; comparing CT data to CAD models; and dimensioning parts within CT scans, i.e. inventing virtual CMM probes. X-rays are not for special occasions, rather they are tools for everyday use.NDT
Tech Tips
There are no radioactive sources in X-ray micro CT.CT combines the penetrating power of X-rays and the ever-increasing data-processing power of the computer.
The metrology applications involving X-ray micro CT are varied and growing.


