
Pictured is the metal grain pattern (left) segmented by the watershed transform. Source: Teledyne DALSA.

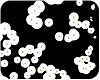
Pictured is the gray-scale image of colonies (top) and segmented (bottom). Source: Teledyne DALSA.
Machine vision is primarily concerned with locating, identifying, measuring and inspecting manufactured parts, such as fasteners, bolts and screws. Manufactured parts have uniform shape and well-defined edges, and so can be precisely and quickly measured. Measures outside of limits signal a defective part.
Image analysis is primarily concerned with measuring natural or non-manufactured parts and patterns. Applications include classifying and counting biological cells and characterizing particles, textures or foams. These “parts” can vary widely in shape and have poorly-defined edges. We usually know only some general characteristics of the objects being analyzed. In a magnified view of metal grains, for example, we only know that grain boundaries have a different intensity and that grain size has a limited range and orientation. But we don’t know the grain shape.
The first step in image analysis is segmentation-separating objects or parts from each other and the image background. When you look at your desk, you see things like papers, pencils and phones as separate objects. However, in a digital image of your desk, the intensity of the objects and the desk overlap and so segmentation is very difficult. We use massive neural computation and an extensive knowledge of what objects look like to do segmentation, but these are not practical in a commercial image analysis system.
To make segmentation easier, we can use physical methods that amplify intensity or color differences between objects and their backgrounds. For example, very uniform illumination will “factor out” intensity differences due to lighting variations, making segmentation more reliable. For biological samples, staining adds contrast and color to different cell types. You would like to be able to segment objects using a simple intensity or color threshold, but image noise suppression and more sophisticated segmentation methods are often needed.
In machine vision, when we measure dimensions to high precision the image processing operations shouldn’t change these dimensions. Image analysis often uses morphological image processing operations that modify object shapes and dimensions based on neighboring pixel values. Precise dimensioning is less of a concern on natural objects and morphological operations are good at suppressing noise and helping segment objects from their background.
Two common morphological operations are erosion and dilation. Assume that the objects being analyzed are brighter than the image background and have a known average size. Erosion “peels off” pixels around an object and so separates touching objects and removes bright spots. Dilation adds pixels around objects to fill in gaps between objects and remove dark spots. You can set the size of these operations to eliminate spots up to a specified size. Combining these operations gives the opening and closing operations which also reduce noise but better maintain the objects’ dimensions.
After “cleaning up” the image, we might segment objects in the image using a threshold. A threshold labels pixels above a specified value as object and pixels below this value as background, or vice versa. The resulting binary (black and white) image often has isolated groups of pixels that are not objects or objects that touch each other. Again, morphological operations, such as erosion, can be used to remove this noise and separate objects.
More sophisticated segmentation algorithms use more information than just the object and background intensities. They could use object edges, where intensity changes rapidly, or slowly changing interior values of an object to aid segmentation. Prior knowledge of the objects’ shapes and sizes can also improve segmentation.
The watershed transform is an interesting example of a sophisticated segmentation algorithm. Assume object interiors are darker than their background or their edges, and consider the image as a topographic map. Objects are basins in this topography. In analogy with geographic watersheds, basins meet at “watershed pixels” and these boundaries segment objects. If we “fill” each image basin until its “water” meets that of another basin, the meeting points will be the watershed pixels. This algorithm is used in image analysis tasks such as reading DNA samples and sizing metal grains. By marking different objects with different colors, we can visualize the segmentation.
Segmentation often results in a binary (black and white) image where bright pixels represent objects and dark pixels are background (or vice versa). In this case we can visualize the segmentation simply by displaying the binary image. The pixels that represent objects are collected into objects areas using connectivity analysis.
Connectivity analysis groups segmented pixels into object areas. This grouping is based on neighboring pixels touching each other or having the same segment label-color in the case of the watershed. Compared to the steps you have just read about, this one is easy. These areas are sometimes known as blobs as, at this point, we only know that their pixels have the same segment label and touch each other.
Next we measure blobs, a process sometimes called blob analysis. We count and index blobs and, for each blob, we record measures such as the number of pixels in the blob, its center of gravity and its bounding box-the rectangle that just encloses the blob. We can apply many other measures based on a blob’s area and dimensions. For example, Feret’s Diameter is the longest distance between two points on the blob’s perimeter-like an outside caliper at a specified angle.
Measures that use distances along a curve can be tricky. Curve distances are poorly defined in a digital image-especially images with binary (black and white) intensity values. Consider a circular blob’s perimeter. If you look at this blob in a digital image, you see that the edge changes in integral pixel steps, rather than smoothly. If you sum these steps’ edge distances you will get a perimeter that is more that the perimeter predicted from the circle’s diameter. Curve measures can be improved by using information from the original, gray-scale image, but you should still be careful when using measures based on distances along a curve.
The choice of measures is based on what you are trying to do. If, for example, you wanted to know the distribution of elliptical particles’ shapes, you could measure blob circularity.
Usually the last step in image analysis is classification. Classification assigns blobs to one or another object classes based on blob measures. Suppose you are culturing biological cells to produce medicine. You want to monitor the health of this process by counting live and dead cells in a sample, and are able to do so because live cells are larger and more circular than dead cells. The classification is usually imperfect due to object variations-say, live and dead cells that have overlapping size ranges. You have to factor in the cost of an incorrect classification and, if necessary, add more measures to improve the classification’s reliability.
To put this together, let’s do an example of image analysis. In food production, such as at a bakery or milk processing plant, the level of airborne mold spores are monitored by exposing nutrient-filled dishes in the processing areas. The spores land on the nutrient and grow into circular colonies. The number and size and shape of these colonies are measures of the spore density in the processing areas. High spore densities require corrective action, such as wash-down with disinfectant and changing outside air filters.
A gray-scale image of some of the colonies is first smoothed to make subsequent processing more stable. Erosion and dilation (morphological opening) remove background noise and separate some touching colonies. Segmentation into blobs is done by a threshold. Note that the sample lighting decreases slightly on the right; that should be corrected before applying a threshold. Blobs are sent through connectivity analysis and blobs smaller than the expected colony size are removed (the Remove Blobs) operation.
Spores grow circular from point where they land and close spores have overlapping growth. A distance transform gives the distance of each pixel to the nearest blob edge. Peaks in the distance transform values will be close to the center of a growth circle (the spore landing point), thus allowing us to count overlapping colonies.
Image analysis is a vital tool for quality control, particularly when the product being monitored is not precisely made or has high natural variability. It can be applied to products such as ones that are grown or crystallized, particulates, biological products and food. The techniques of image analysis are often used in machine vision to help detect product defects, such as scratches and stains, that can’t be exactly specified in advance.V&S
Pictured is the result of processing colony blobs with a distance transform. The center point of each growth circle is marked by a small black square and a yellow number. Source: Teledyne DALSA.
References
Try out image analysis using ImageJ:http://rsbweb.nih.gov/ij/Industrial image analysis:http://www.teledynedalsa.com/ipd/products/sherlock.aspx
Image analysis software primarily for microscopy:http://www.mediacy.com
Tech Tips
To make segmentation easier, use physical methods that amplify intensity or color differences between objects and their backgrounds.Segmentation often results in a binary (black and white) image where bright pixels represent objects and dark pixels are background (or vice versa).
Image analysis is a vital tool for quality control and can be applied to products such as ones that are grown or crystallized, particulates, biological products and food.

