

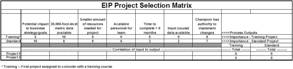
Table 1: EIP Project Selection Matrix 1
*Training--First project assigned to go with a training course.
*Training--First project assigned to go with a training course.
All projects in an EIP should be in alignment with the business goals and could be undertaken; however, organizations often not have the bandwidth to undertake all projects at once. When this occurs, organizations need a system where they can prioritize EIP created projects.
Table1 illustrates a project prioritization selection matrix of identified EIP projects, which uses criteria that has different weighting. Projects with the largest total score have the highest perceived priority and would be assigned to the appropriate black belts or green belts.
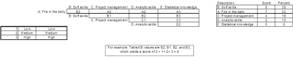
Figure 1: Illustration of analytical hierarchy process (AHP) for categories within prioritization matrix: Black belt selection process.1
By doing this, we are prioritizing projects to execute that have been pulled for creation by metric improvement needs, which have alignment with business goals. This is different than simply listing projects that could be undertaken and then voting using a project selection matrix; i.e., a push for project creation. With a push for project creation system, we can be spending much effort on suboptimizing processes that, when improved, do not truly impact the business metrics as a whole.
When using this prioritization matrix, care needs to be exercised. Users should not consider small project score separations to be important relative to establishing overall project priorities; i.e., similar scores in the right two matrix columns for two or more projects should be treated as equal scores. A project priority grouping can be identified if there is natural separation between ranked scores.
Often, people have difficulty establishing a criteria importance spread between categories. In an extreme situation, there are no between-categories spread when all categories are assigned an importance criterion of ten.
The analytical hierarchy process (AHP), which is a methodology to get around this problem. AHP forces the creation of importance values that have larger separation.
In the AHP approach, a number of decision-makers can integrate their priorities into a single priority matrix using a pair-wise fashion. This result of this matrix is a prioritization of the factors. Figure 1 shows the result of a paired comparison of all characteristics that are being considered within the selection of Lean Six Sigma Black Belts. Within this AHP, for example, the cell response of B2 when comparing factor "A: Fire in the belly" with factor "B: Soft skills" would indicate that the team thought factor B was more important than factor A at a medium level. After completing the matrix, the team sums values for all factors and then normalizes these values to a scale, for example 100. An AHP could be used to quantify the importance category used in the creation of a cause-and-effect matrix; i.e., the top numeric row shown in Table 1.
Reference:
1. Breyfogle, F. W., 2008. Integrated Enterprise Excellence Volume II – Business Deployment: A Leader’s Guide for Going Beyond Lean Six Sigma and the Balanced Scorecard
Recent Comments
Therefore great deal to take place over kinds...
Gee… I translate writes on a similar to...
As it turned out, it is quite possible...
For some it is significant, and so research...
nike tiffany and co jacket