Sponsored Content
How to Predict and Prevent Product Failure
Preventing both warranty issues and field problems due to lack of product reliability.
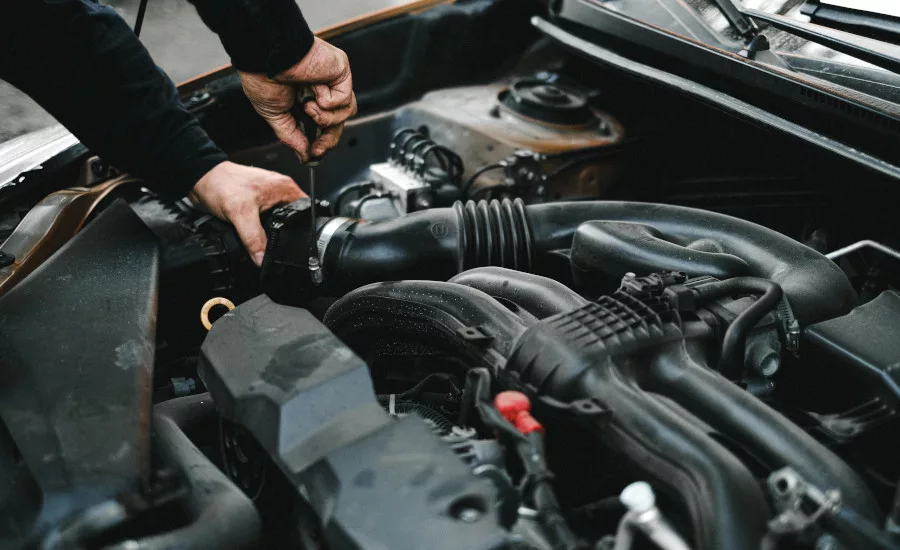
Imagine your new car breaks down after driving 60 miles. The engine light turns on and your vehicle must now be towed to be serviced. This is not only a warranty issue but also a field problem due to lack of product reliability.
Reliability is defined as the quality of a product over time and statistically speaking it is the probability of a product not to fail during a defined period of time.

THE RISK OF FAILURE
In cases like this one, the original equipment manufacturers (OEM) would be at fault. These OEMS must then quickly find the root cause and determine the risk for other vehicles still operating in field so they can predict how many additional vehicles will return with the same problem or continue driving with no problems at all (also called survivors). Eventually if the risk is high enough, a vehicle recall in that market could be necessary.
Once the part that has failed has been found, you would determine the outstanding risk* and begin calculating the probability for a given time period. Generally, life data (e.g. cycles, mileage, operating time) does not often fit the normal distribution, so the Weibull distribution model model is recommended to perform the reliability analysis to make predictions using Minitab Statistical Software.
To perform the reliability analysis in Minitab Statistical Software, the following data is required:
- Failure quantity
- Mileage at failure
- Failure date
- Production date of failed parts
- Vehicle registration date
- Volume produced during the period at stake
With the data above, we can provide the required inputs for the analysis using Minitab Statistical Software.
A CLOSER LOOK AT THE DATA
42 vehicles failed in field due to a malfunction of the fuel injection equipment. These were reported by Original Equipment Manufacturers. The number is low compared to 11.9 million parts produced because early failures, namely infant mortality, were also recorded.
Even though some parts have failed, survivors still operate in field. We need consider the quantity of survivors and their mileage to date.
RUNNING THE RELIABILITY ANALYSIS
A Parametric Distribution Analysis will help us to calculate how many vehicles are likely to fail.
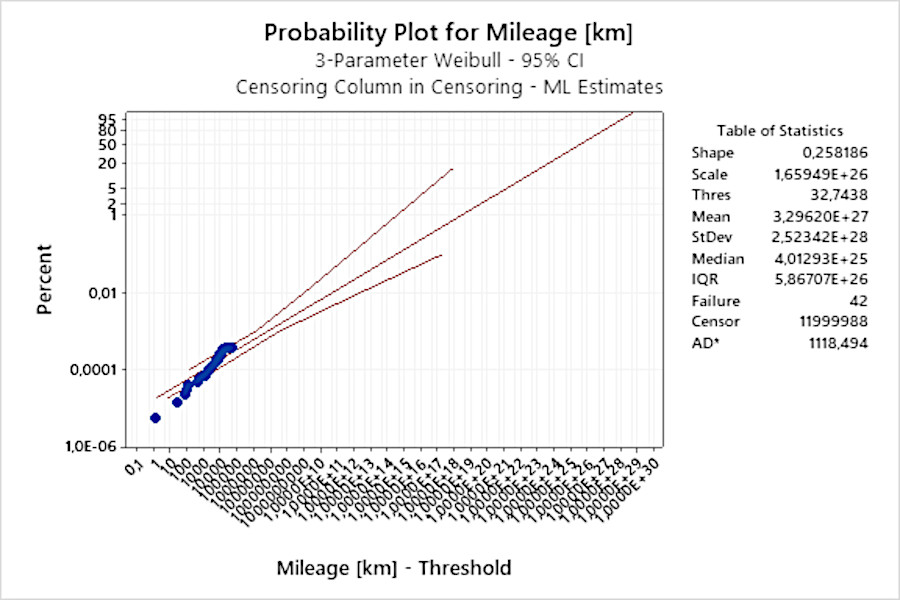
Graph: Weibull Probability Plot (Click on the image to enlarge.)
HOW MANY VEHICLES ARE LIKELY TO FAIL?
Vehicles drive in average approximately 45000 kilometers a year. The estimated cumulative probability until 45000 kilometers and until 135000 kilometers are reported in the table displayed below.
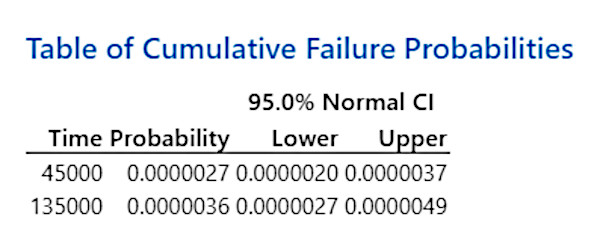
Table: Cumulative Failure Probabilities (Click on the image to enlarge.)
11.9 million parts were produced. The 95% Confidence level upper bound estimates the maximum expected return failure of 0.0000037. As a consequence, out of 1 million parts we can expect 3.7 failures.
Out of 11.9 million vehicles, 44 vehicles are likely to fail:
11.9 million parts x 3.7 parts per million = 44 parts likely to fail
42 vehicles have already failed, 2 are expected as potential returns below 45000 km.
Original Equipment Manufacturers have usually signed a warranty agreement with component suppliers: parts must not fail under a set period of time.
This data-driven approach is useful .
Minitab Statistical Software offers a wide range of functionality for calculating the reliability of product, some of which were demonstrated in this example.
* Note: Risk is determined both qualitatively and quantitatively, but we have focused on the quantitative aspect only in this blog.
Minitab empowers all parts of an organization to predict better outcomes, design better products, and improve processes to generate higher revenues and reduce costs. Visit our website to learn more.
Looking for a reprint of this article?
From high-res PDFs to custom plaques, order your copy today!


