Sponsored Content
Save Time and money with the right CI Tool

Just a few years ago I was a Continuous Improvement (CI) and global Operational Excellence (OpEx) leader for a large, world-wide company. Now I work for Minitab trying to help customers overcome the struggles that I faced when I was in their shoes. Namely, helping our customers do their jobs much better, faster, and more thoroughly. That’s what solution architects get to do here!
Leaders face challenges to get software to help their technical leaders, project managers, and CI operations with their work. All too often, senior leadership thinks enterprise-wide generalist software like Excel will suffice, but that’s far from what their teams need. Companies are losing too much money because they don’t have the right tools. Here I will share my findings about this conundrum.
DIFFERENT TOOLS FOR DIFFERENT ROLES
From my experience, I know that most companies have some form of project management in place. I often see people getting blocked from getting the help they need in the process, often due to these three sources of confusion:
- Technical leaders are already using their own project trackers (often spreadsheets)
- Project managers are using project management software (Gantt charts in MS Project or SmartSheet, for example)
- CI reporting is entirely separate from project trackers and project management.
None of these are in conflict. In fact, I’d say every company needs all three. They all serve very different purposes:
- Technical leaders need to track action items through to completion so the functionality of the product or process they are working on meets requirements.
- Project managers need to track cost and timing to make sure everything gets done on time. Their job meshes well with the technical leaders, but each are responsible for different things. They manage them differently… and so we have spreadsheets and Gantt charts.
- Growing up as an engineer we always tracked our projects in Excel or Google sheets. Project trackers were updated regularly as to who is doing what, and when. We didn’t always use a Gantt chart – it was more of an activity log.

Project managers were always tracking the same projects as we engineers tracked but at a much higher level. They would not be concerned about a detail like “improve process step 12” but rather something more like “create process.” A big task like that may have intermediate tasks like “run process at 50% rate,” “run process at full rate,” and “process signoff.”
![]()
GETTING A DASHBOARD VIEW
Continuous improvement would be responsible for some things like those mentioned above, but at a different level still. CI also had to report on savings. This is a different ask than what technical leaders elsewhere had to report (closure of actions) and what project managers had to report (risks to schedule). A CI dashboard could look like the following:
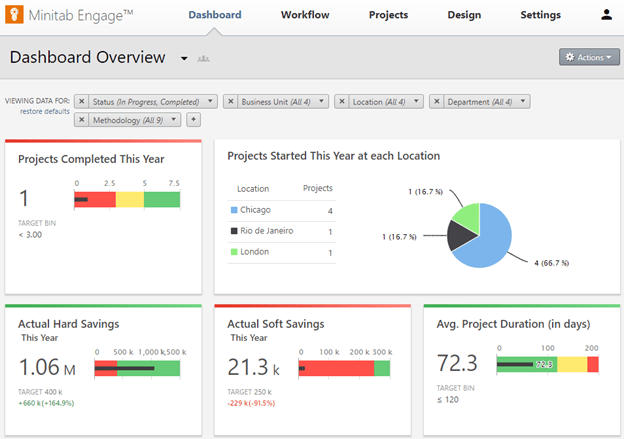
You can see savings vs. goals and the ability to filter by location or anything you like.
As you can see, this is in no way competition with Excel, SmartSheets, Microsoft Project, or anything already in use by the rest of the company.
You can track projects in Minitab Engage too (in importantly different ways than the enterprise-wide project management does… this is specific to your improvement program!)
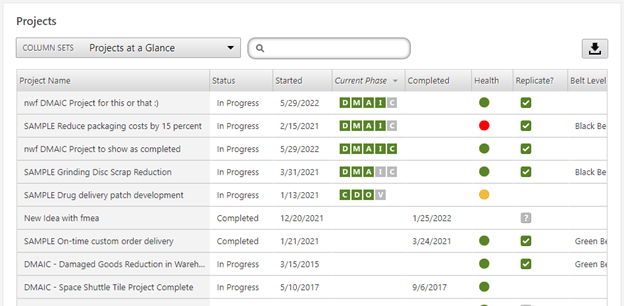
Admittedly, the projects above are from my demo account… give Minitab a call and we can walk you through any of these in more detail! Notice, however, the interesting and specific terminology here: we have a phase column. If any of you have utilized DMAIC before you know it’s tempting to put a band aid on a problem and never really find root cause. This doesn’t prevent that root cause from happening again. In this view you can see that all but one project has gotten stuck in the Improve phase (only one project made it through C: Control phase). Heck, one project has even raised the red flag and asked for help (visible in the health column as a red dot). There are a lot more columns here, you could search this listing by coach (“Minitab Engage, please show me all project that MBB Celia Bedelia is mentoring”). This software also provides notifications prior to missing a due date and continuing after a date is missed until completed.
A very nice way that this type of CI tracking could complement technical leaders and or project managers' work is to simply provide a link to the project for them to include as a hyperlink in their spreadsheets, Gantt charts or report outs.
WHAT SETS MINITAB ENGAGE APART FROM OTHER PROJECT MANAGEMENT TOOLS
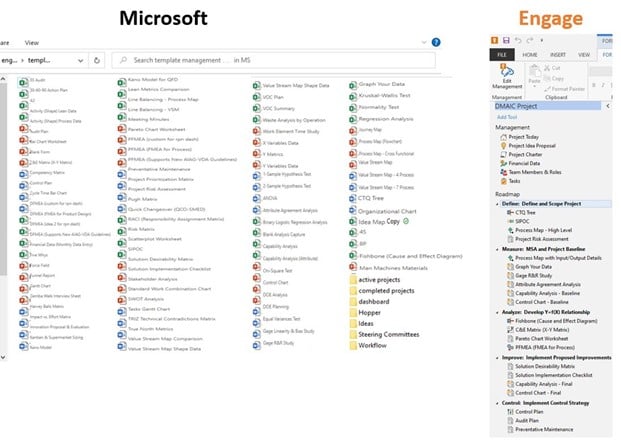
Minitab Engage is not only about dashboarding… in fact, I think the best features might be in the improvement tools. There are over 90 tools that you probably know. It’s shocking to me that our engineers collected all these forms, mapping tools, analysis tools into one software package.
Some of my favorites are fishbone, process map, VSM, five whys, 5S, A3, RACI, SIPOC, and Monte Carlo… but the list goes on and on. Here’s a full list of Minitab Engage features.
Why would these matter to a company that already has an Excel or PowerPoint-based fishbone? Great question… do you like using that template? I never did… it was terribly hard to use, and tedious. Other tools are meant for general purposes, anyone can use them for anything (which is why it’s not great for you). Minitab Engage is custom built for your improvement program… and that’s why it has all these extra little details that make it so much better.
You also don’t have to manage the templates’ revisions or protect them from being edited by others. In my prior experience, we had a huge library of templates. Some were pretty good… but they would drift (meaning other people would change them either intentionally or unintentionally). This would wreak havoc on the rest of the company looking for the original, unmodified template. There were so many files it became hard to find what you need, copies upon copies all searchable in google drive made it surprisingly hard.
With Minitab Engage you never have to worry about that. In fact, you could make custom roadmaps to organize sets of tools (most customers like the DMAIC roadmap that comes with Minitab Engage along with a handful of others… but you can customize your own as well.)
Sometimes an improvement program has trouble getting funding. This always surprised me since every dollar spent on improvement has a return on investment. We do these things to save the company money! But, alas, money is scarce, and without proof of your program’s value you can’t always get funding. Minitab Engage helps solve this.
Minitab Engage works with anything you are already doing at a higher, enterprise-wide level.
Looking for a reprint of this article?
From high-res PDFs to custom plaques, order your copy today!


