Sponsored Content
Getting Started with Process Maps

A process map is a visual way to identify all the steps and activities as they flow through the process. Process maps also help you to see the relationship between inputs and outputs, identify key decision points, identify sources of bottlenecks, and uncover rework loops. Drawing a map for your process also makes it easy to communicate it with others and see relationships both for people and actions. If you are just starting to learn more about creating process maps with Minitab Workspace, here are some helpful tips to get you started.

PLANNING YOUR PROCESS MAP
- As a team, determine where the process starts and where it ends, then walk through each step of the process.
- Identify the data associated with each step of the process. Consider the following items.
- Activities: Names of the steps in the process map.
- Inputs: X variables that can influence the output of interest, either directly or indirectly.
- Outputs: Y variables that depend on X variables.
- Process data: Information that further defines the characteristics of a process, such as the yield or DPMO at each step.
- Lean data: Information that is used to identify and eliminate waste, such as resource utilization or cycle time at each step.
Record the collected information in a process map.
- From the navigator pane, select Add Tool, then select Process Map to see the available process map templates. You can also browse through the list of tools or start typing the tool name in the Search
- Select Create to add the tool to your project.
ADDING SHAPES AND CONNECTORS
Key shapes included in process maps:
Start 
Use the Start shape to represent the start of the process.
End 
Use the End shape to represent the end of the process.
Process 
Use the Process shape to represent a process, task, action, or operation.
Decision 
Use the Decision shape to ask a question. The answer to the question determines which path you follow from the decision shape.
There are many other shapes available in Minitab Workspace and Minitab Engage. Select Shapes in the toolbar to see a list of all the shapes that are available.
Complete the following steps to add shapes and connectors to your process map.:
In the Shapes gallery, select a shape, then select the workspace.
- To connect the shapes, select a connector in the Shapes gallery.
- To ensure that shapes stay connected even when you move them, connect the shapes at their anchor points. Anchor points turn green when they are connected to a shape.

Start point
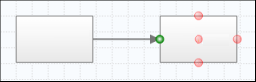
End point
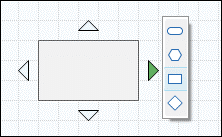
Tip: To quickly connect shapes at their anchor points, select a shape on the map, select the arrow in the direction where you want to place the new shape, then choose the shape.
READY TO MAKE A PROCESS MAP FOR YOURSELF?
You can begin drawing on a white board or with just pen and paper, but for a polished process map that is worth sharing with your team and leadership, we recommend Minitab Workspace. This visual toolkit ensures process and product excellence in an easy-to-use interface. with an abundance of helpful tools in one place right at your fingertips to help you visual, optimize and map your business value and achieve greater impact better than ever before.
It's easy to try! Get a FREE 30-day free trial of Minitab Workspace today
Looking for a reprint of this article?
From high-res PDFs to custom plaques, order your copy today!


