Measurement
Unraveling the Tom Brady Deflategate
A comprehensive analysis of measurements, traceability, and uncertainty in the Tom Brady controversy.
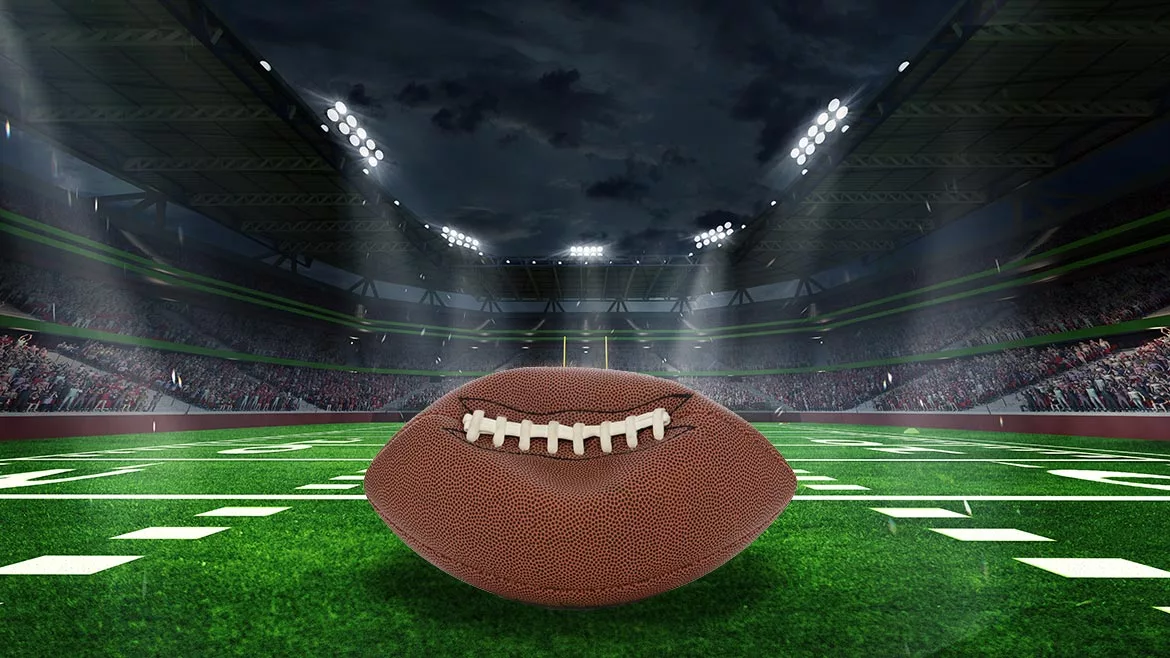
Image Source: Scukrov and master1305 / iStock / Getty Images Plus via Getty Images
Introduction
The "Deflategate" scandal is one of the most infamous controversies in the National Football League (NFL) history, centered around the legendary quarterback Tom Brady and the New England Patriots.
This scandal erupted following the 2014 AFC Championship Game between the Patriots and the Indianapolis Colts when accusations emerged that the Patriots had intentionally deflated footballs to gain an unfair advantage.
As one of the sport's most accomplished and recognizable figures, Tom Brady's involvement added even more intrigue to the saga.
The example we will present is a walkthrough of measurements, from establishing metrological traceability, calculating measurement uncertainty correctly, and applying that to making a conformity assessment that will show if the NFL was right to suspend Tom Brady for four games.
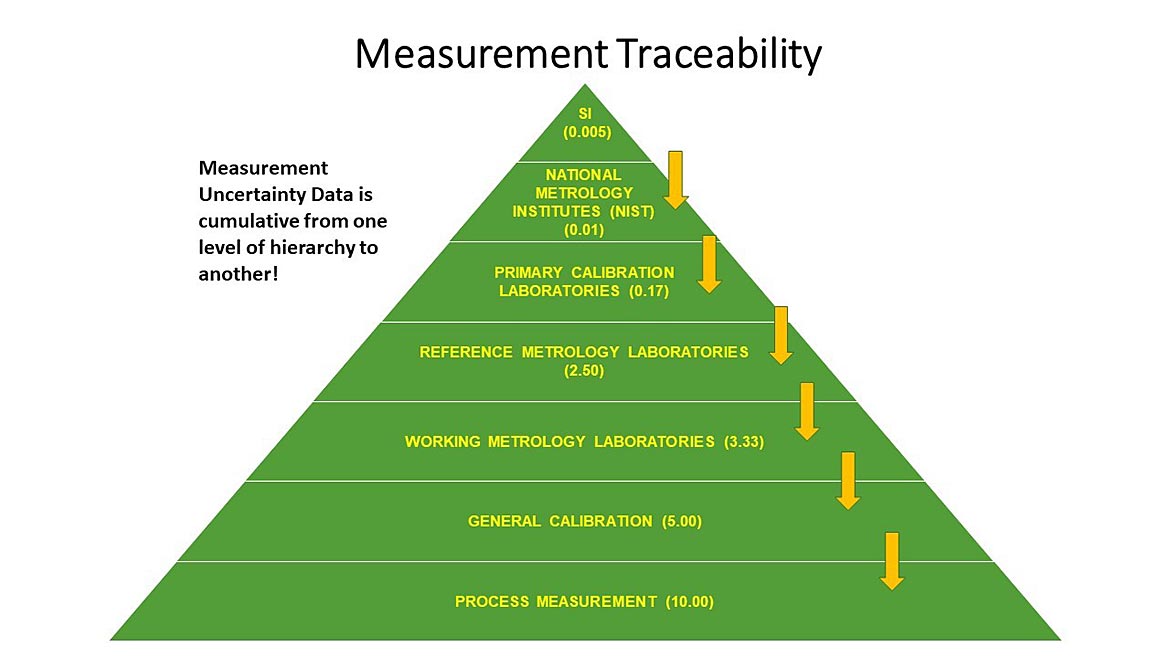
Figure 1 Measurement Traceability Pyramid
Metrological Traceability Basics
The Vocabulary of International Metrology (VIM) defines Metrological Traceability as the "property of a measurement result whereby the result can be related to a reference through a documented unbroken chain of calibrations, each contributing to the measurement uncertainty."
The basic premise of the concept of metrological traceability is that there is uncertainty or "doubt" in all measurements and that the calibrated instrument's uncertainty cannot be less than that of whoever performed the calibration.
An example would be a pressure gage with a specification of ± 0.05 % (± 0.015 psig) used to measure the pressure in a football is sent to a laboratory that can measure pressure within ± 0.1 % (± 0.030 psig).
Even though the pressure gauge is capable of ± 0.05 % (± 0.015 PSIG), the Measurement Uncertainty of the lab performing the calibration is such that the best the gauge could measure after calibration would be greater than ± 0.1 % (± 0.030 psig).
The simple math tells us 0.1 % is greater than 0.05 %.
Measurement Uncertainty
As mentioned earlier, measurement uncertainty can be considered "doubt." This means I measured the pressure in my football to be 12.6 psig, though my ability to measure that 12.6 psig is ± 1 psig. Therefore, the actual value would be between 11.6 psig and 13.6 psig.
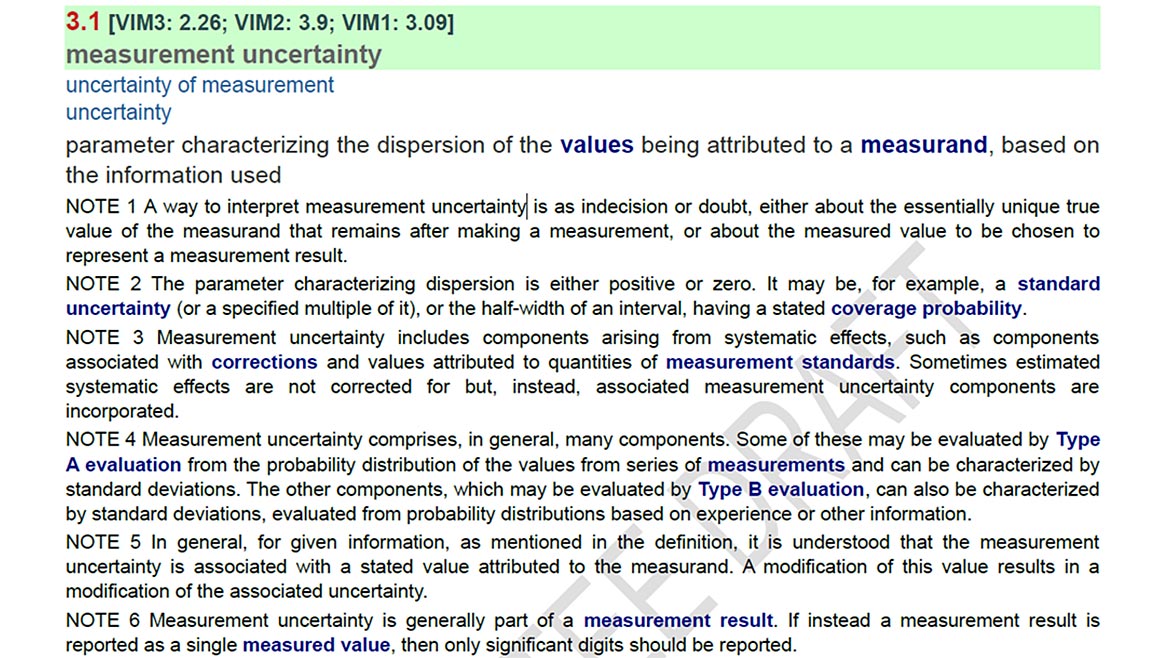
Figure 2 The Formal Definition of Measurement Uncertainty from (VIM4 CD) 1
The ability to calculate measurement uncertainty correctly is something many quality managers struggle with. There are several documents, papers, and books on this complex topic beyond the scope of this paper.
In general, measurement uncertainty includes contributions from our measurement process that account for the standard used to perform the calibration (the reference), the device we are testing, environmental influences, the resolution in which the devices can be read, the ability of the operators or equipment measuring to make replicate measurements, and more.
Measurement Uncertainty And Conformity Assessment (Pass/Fail)
Measurement uncertainty keeps us honest. If we think about making a conformity assessment of "pass" or "fail," the more significant your measurement uncertainty, the more likely you are to "fail" an instrument.
Using the analogy of a parking space, the lines are your tolerance limits. When measurement uncertainty is small, you have a parking space large enough to park easily. This means you have more space, or range, to "pass" an instrument.
Figure 3 When the Uncertainty is small
However, you have less room to park when your uncertainty is larger. This means you have less range, sometimes no range, to "pass" an instrument.
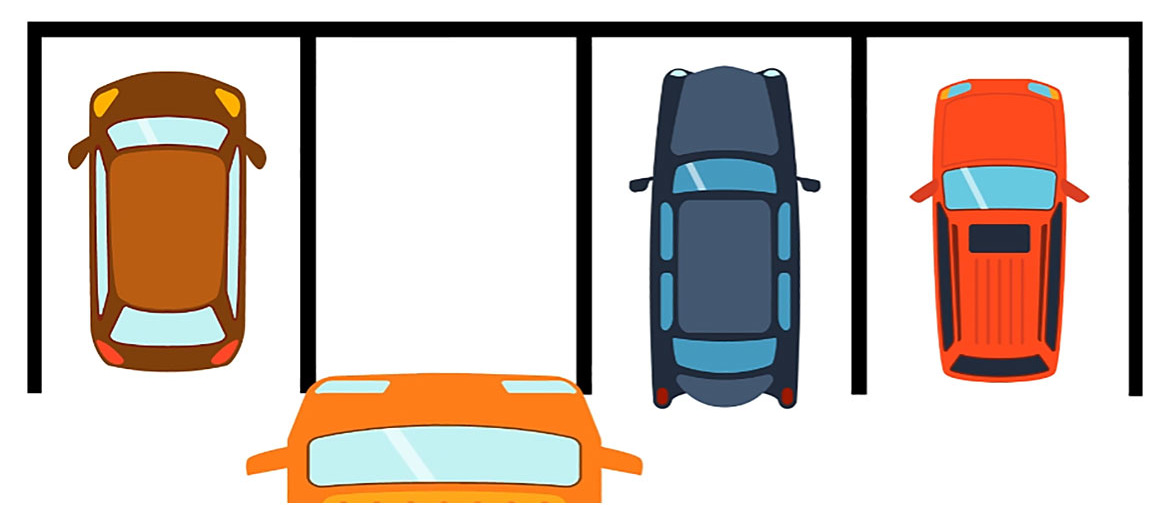
Figure 4 When the Uncertainty is large.
When discussing decision rules (how we will decide if the footballs were within specification), we describe how measurement uncertainty is accounted for when stating conformity with a specified requirement. For most, the conformity statement is binary, meaning either a Pass or a Fail. Some standards recommend setting limits, so a failure occurs if the Probability of Conforming to the Specifications is higher than 2 %.
Now that the basics of Measurement Traceability, Measurement Uncertainty, and Conformity Assessment are covered, we can examine if the NFL could prove that Tom Brady and the Patriots deflated the footballs.
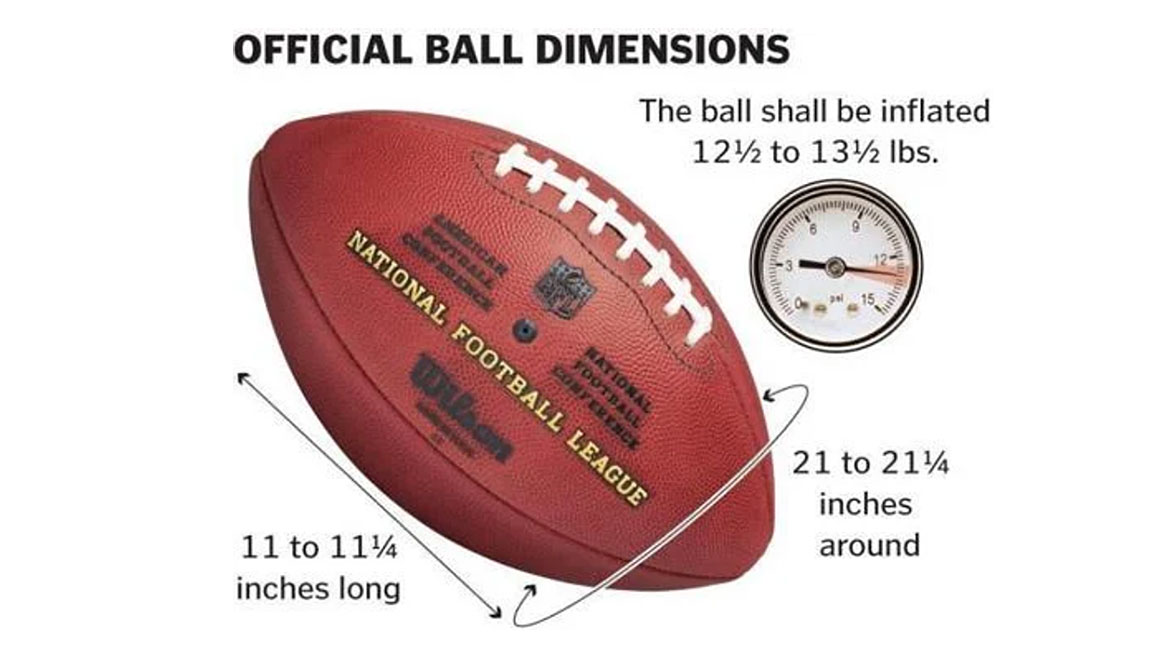
Figure 5 Official Ball Dimensions
Case Study – “Deflate Gate”
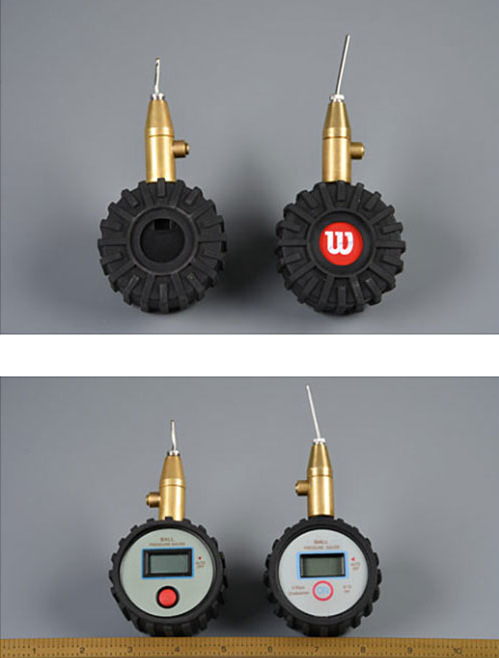
Figure 6 Pressure Gauges used by the championship officials to measure internal air pressure at halftime. (Exponent 2015) 3
NFL Rulebook (Goodell 2014) states, "The ball shall be made up of an inflated (12.5 to 13.5 pounds) urethane bladder enclosed in a pebble-grained, leather case (natural tan color) without corrugations of any kind. It shall have the form of a prolate spheroid, and the size and weight shall be:
Long axis = 11 to 11.25"
Long circumference = 28 to 28.5"
Short circumference = 21 to 21.25"
Weight = 14 to 15 oz.”2
For our discussion, we will focus on the specification limits of 12.5 to 13.5 psig, even though the NFL requirements seem to use improper units of pounds.
The NFL officials used two separate gauges to verify the specifications at halftime. These gauges were not calibrated and, therefore, lacked metrological traceability. They used a “no name” brand and one with a Wilson logo, model CJ-01 manufactured by Jiao Hsiung. 3
The officials made two independent measurements on each ball (11 balls), with a different gauge. Something we have not covered is a low sample size in measurements.
The gist here is that with only two samples, and we wanted a 95 % level of confidence, we would need to multiple by a coverage factor of k= 12.71, resulting in a much larger expanded uncertainty.
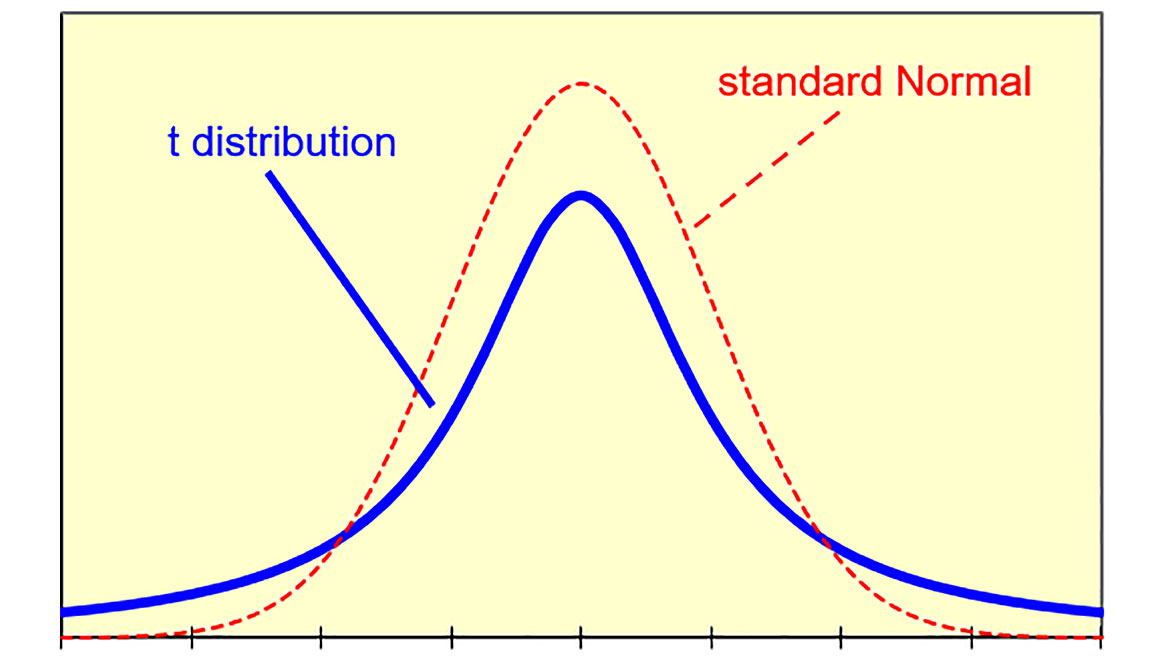
Figure 7 T Distribution with sample size of 2
This calculation can easily be performed using Excel. The equation is =TINV((1-Confidence), Degrees of Freedom). In the figure above this equate to TINV((1-0.95),1)
Confidence of 95 % is 0.95.
The t-distribution is used for estimating population parameters for small sample sizes. The smaller the sample size, the larger the coverage factor. Thus, the more measurements are made, the smaller the coverage factor.
If the NFL had made 5 measurements, the coverage factor would have been about 2.78.
And this is only one component of the measurement uncertainty.
Each of these gauges had no stated accuracy. The only thing we know is that the resolution was 0.05 psig.
Not having accuracy is an issue, though; from similar gauges available with accuracy, we can likely deduce that these gauges were, at best ± 1 % of full scale.
The accuracy would then be ± 0.2 psig.
Thus, we now have three components of our Measurement Uncertainty Budget that are:
Specification 13 ± 0.5 psig
Resolution 0.05 psig
Accuracy ± 0.2 psig.
The example below could be considered the minimum requirement to calculate measurement uncertainty.
When we look at the uncertainty of our measurement of pressure using the pressure gauges the NFL used, we are looking at the accuracy of the pressure gauges, the standard deviation of replicate measurements, and the resolution of what we are testing as the bare minimum.
Other considerations would include the environment, the uncertainty of the reference standard used, the stability of the reference, the reproducibility, the repeatability and reproducibility of the refs, and other factors specific to the calibration process.
Note: JCGM 100:2008 Evaluation of measurement data — Guide to the expression of uncertainty in measurement has more information on measurement calculation.
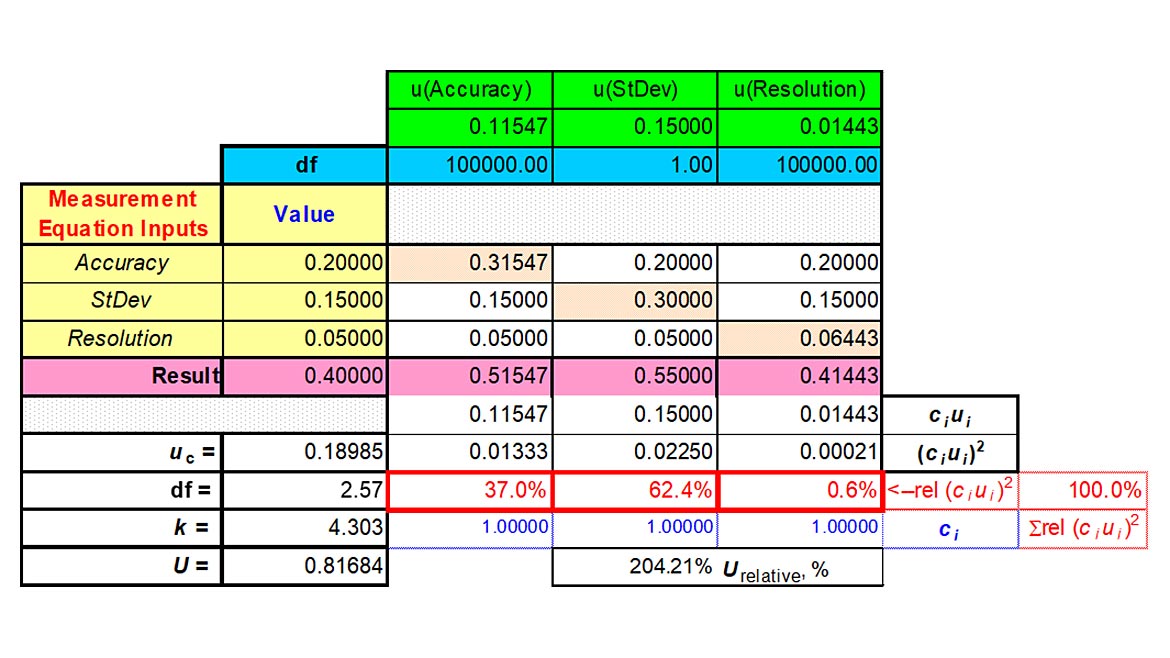
Figure 8: The Incomplete Expanded Uncertainty of the NFL measurement.
The overall Expanded Uncertainty using the information we have is ± 0.81684 psig. This is incredibly incomplete summary of the measurement uncertainty as it lacks several much-needed components reference in the above text.
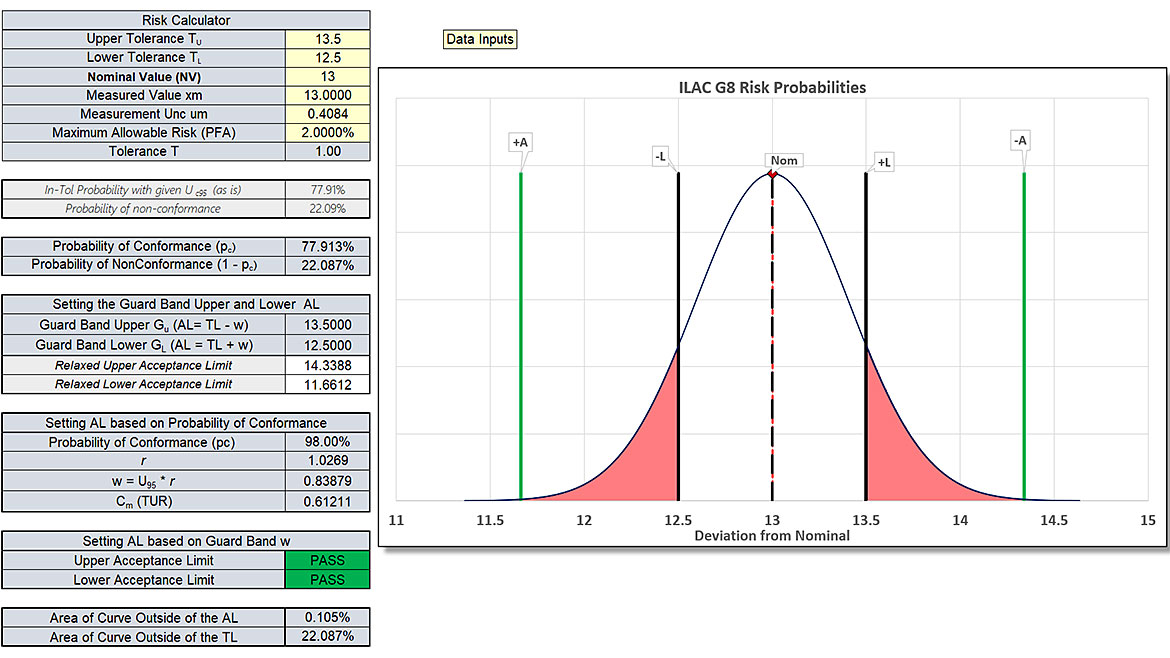
Figure 9 Specific Risk Calculator Showing Probability of Conformance of 77.913 %
We get the above image when we look at our ability to prove something is in conformance using ± 0.81684 psig.
The image shows a measured value of 13.00 psig, and with the large uncertainty, if our device read nominal, there would be a 77.913 % chance we are saying the measured value of 13 psig is good.
Thus, the gauges are not adequate to measure ± 0.5 psig.
In addition, our estimated uncertainty is likely a best-case scenario as the uncertainty of whatever “master gauge” was used to calibrate these gauges was not incorporated into the Expanded Uncertainty budget; if it were, the overall Expanded Uncertainty would be higher than ± 0.81684 psig.
One of the balls measured 11.7 psig ± 0.81. This means the ball's psig was likely between 11.06 and 12.51.
In this case, there was a possibility the ball was within the specification.
Furthermore, several manufacturers of pressure gauges-making equipment could easily measure the pressure of a football to within ± 0.025 psig (20 times better than the NFL specification).
“Deflate Gate” – Conclusion
Establishing metrological traceability and calculating measurement uncertainty needs to happen to make measurements.
The measurement uncertainty must be evaluated when determining pass/fail, innocence, or guilt.
Can you imagine being convicted of murder because the DNA was a 2% match?
The evidence in the deflate gate case certainly suggests the balls were light, though, to quote Lloyd Christmas in Dumb and Dumber, “So, you’re telling me there’s a chance?” there is a chance at least the ball that measured 11.7 psig was within the specification.
The NFL reportedly spent 22.5 million by the end of the investigation and likely needed to do so as they did not follow the measurement practices needed; if they had evaluated their equipment, they would have known they needed better equipment to withhold that specification.
This simple case study involves a football in a very lopsided game. The implication on human life is minimal at best.
Organizations worldwide making decisions that impact our safety are doing the same things. Companies are buying equipment and passing product that is not fit for use and rejecting product that is.
The cost is likely in the billions, if not trillions. If you happened to read this article, please think about the bottom-line cost of using the wrong equipment and how much you might save buying better test and measuring equipment.
People often buy at low cost, which is a high cost when you look at rejecting or accepting products, as equipment with lower measurement uncertainties, could save your organization a lot of money.
Acknowledgments
The inspiration for this article came from “The Introduction to Statistics in Metrology”, specifically chapter 5. The authors highly recommend anyone wanting to learn more about metrology to pick up a copy of this book.3
References:
- International Vocabulary of Metrology (VIM) version JCGM-WG2-CD-01
- NFL Rulebook 2014 official playing rules of the National Football League. National Football League. (2014)
- Introduction to Statistics in Metrology
Looking for a reprint of this article?
From high-res PDFs to custom plaques, order your copy today!


