Four Variables that Affect Sensor Performance
Balancing all four variables is crucial, as they can greatly affect the performance of a particular sensor.

To use a laser displacement sensor more effectively, operators must understand how to balance sampling rate, the number of averages, beam spot size and target speed. All four of these variables can greatly affect the performance of a particular sensor.
When optimized for a particular target and, more importantly, a particular purpose, it is possible to determine whether the sensor works or not. Lasers interact with the surface of a target, and that interaction affects the stability of the resulting measurement.
Some surfaces reflect laser light very efficiently (mirrors) while others absorb more of the laser light (black rubber). Other important factors include the surface topography. Not all targets are flat and smooth. Targets can be woven material or have the surface roughness of sandpaper.
Based on the material, the reflected beam spot can change shape, reflect at too steep of an angle to be measured or not reflect with enough light intensity to ensure a stable measurement. Knowing the purpose of the measurement, sampling rate, number of averages, beam spot size and speed of the target is crucial.
On a stationary target, the number of samples may not make much difference. An operator should get about the same information from 200 samples on a spot in a second as they would get from 392,000 samples on a spot in a second. Now, as that target begins to move, the number of samples per second becomes paramount depending on the surface and application. Suppose the target was leads on an integrated circuit (IC) chip and someone wanted to measure coplanarity. To make an accurate measurement the sensor will need a small enough spot to fit on the leads and have a fast enough sampling rate to make an accurate measurement.
By increasing the number of samples per unit length, more information about the target surface can be obtained.

Simple averaging takes a number of samples, averages them together, gives a measurement result and then starts again. Consider an example with simple averaging set to a value of four. Using simple averaging, in this case set to four, only two pieces of usable data are obtained from eight samples.
The second type is a moving average. A moving average calculates the new value on successive samples instead of only at the conclusion of gathering the number of samples. By using the moving average method, much more usable data is obtained from the target surface giving more stable readings.
Beams spots can range in size from 2 to 2,000 microns. Generally, laser displacement sensor manufacturers will offer lasers with two types of spot size, small and large. A small spot can be round or oval and is useful when profiling small shapes and grooves where a larger beam spot will not fit. Larger beam spots are used on rough surfaces in order to get a more stable reading.
Again, in the case of the lead on an IC chip, a large beam spot may be too large to get several samples on the lead surface.

Some simple calculations can be done based on the sampling rate, beam spot size and rate of travel. After these variables are examined, operators have a better idea of where to set the number of averages to get a more stable reading.
Let’s examine the IC leads again to measure coplanarity. We’ll need to make some basic assumptions.
Assume the beam spot is 1 mil
Assume the sampling rate is 5 kHz
Assume the chip is moving at 60 feet per minute
The main issue will be gathering meaningful data from the surface of the leads. To begin with, operators need to determine how much time is available for the sensor to gather information based on the rate of travel of the material. The pins are 0.025 inch wide and the material is moving at 60 feet per minute. From this data one can calculate that the surface can be seen by the sensor for roughly two milliseconds.
Second, one can determine how many samples the sensor can take in this time period. We know the sensor samples at 5 kHz. Again, doing the math, one would come up with about 10 samples. Here is where knowledge of moving averages kicks in. If the number of averages is set to number higher than 10, one will include the influence of the gap between pins. If the value is set to exactly 10, one will include information from one of the gaps. Suppose the number of averages is set to 4. Operators then would have to wait until five samples were taken on the pin to eliminate the influence of the gap between pins. Therefore one could expect to see about five measurements (10 – 5 = 5) on the pin. With a higher number of averages taken, the reading will be more repeatable, but less measurements can be taken.
One more important feature to note is the beam spot size. If the beam spot is 1 mil, and the width of a pin is 25 mil, because the operator is only taking 10 samples on the pin, they are only covering 10 mil of the 25 mil width available. They would not be able to measure small defects. The beam spot may miss them. Operators would either have to slow the target or increase the sampling rate.
Utilizing options built in to most laser displacement sensors can make the difference between an effective tool and wasted effort. Realizing features such as sampling rate, the number of averages, beam spot size and rate of travel of the target have to be taken into consideration when applying a laser displacement sensor correctly. Here we briefly touched on an example where all of the features play a role. V&S

Sampling rate is the number of times a sensor takes a measurement sample per a given period of time.
Averaging is a feature available on most laser displacement sensors. Two types exist: simple averaging and moving averaging.
Understanding how to balance sampling rate is useful when determining what and how much information is gathered per measurement.
To use a laser displacement sensor more effectively, operators must understand how to balance sampling rate, the number of averages, beam spot size and target speed. All four of these variables can greatly affect the performance of a particular sensor.
When optimized for a particular target and, more importantly, a particular purpose, it is possible to determine whether the sensor works or not. Lasers interact with the surface of a target, and that interaction affects the stability of the resulting measurement.
Some surfaces reflect laser light very efficiently (mirrors) while others absorb more of the laser light (black rubber). Other important factors include the surface topography. Not all targets are flat and smooth. Targets can be woven material or have the surface roughness of sandpaper.
Based on the material, the reflected beam spot can change shape, reflect at too steep of an angle to be measured or not reflect with enough light intensity to ensure a stable measurement. Knowing the purpose of the measurement, sampling rate, number of averages, beam spot size and speed of the target is crucial.
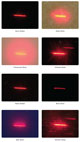
Lasers interact with the surface of a target, and that interaction has an effect on the stability of the resulting measurement. Here are some examples of what the interaction of laser beam spot looks like on some common materials. Source: Keyence
Sampling Rate
Sampling rate is the number of times a sensor takes a measurement sample per a given period of time. Typical sampling rates vary from 200 hertz (Hz) to 392 kilohertz (kHz). This is important when trying to obtain a stable reading. The more samples taken in a given area, the more information the operator has about the topography of that area and thus can make a better determination about how far away that surface is.On a stationary target, the number of samples may not make much difference. An operator should get about the same information from 200 samples on a spot in a second as they would get from 392,000 samples on a spot in a second. Now, as that target begins to move, the number of samples per second becomes paramount depending on the surface and application. Suppose the target was leads on an integrated circuit (IC) chip and someone wanted to measure coplanarity. To make an accurate measurement the sensor will need a small enough spot to fit on the leads and have a fast enough sampling rate to make an accurate measurement.
By increasing the number of samples per unit length, more information about the target surface can be obtained.
Simple Averaging
Simple averaging takes a number of samples, averages them together, gives a measurement result and then starts again. In this illustration, simple averaging is set to a value of 4. Source: Keyence
Simple averaging takes a number of samples, averages them together, gives a measurement result and then starts again. In this illustration, simple averaging is set to a value of 4. Source: Keyence
Number of Averages
Averaging is a feature available on most laser displacement sensors. In the pin coplanarity example, only by averaging the samples taken on the surface of the pins will operators get a stable reading. Two type of averaging exist: simple averaging and moving averaging.Simple averaging takes a number of samples, averages them together, gives a measurement result and then starts again. Consider an example with simple averaging set to a value of four. Using simple averaging, in this case set to four, only two pieces of usable data are obtained from eight samples.
The second type is a moving average. A moving average calculates the new value on successive samples instead of only at the conclusion of gathering the number of samples. By using the moving average method, much more usable data is obtained from the target surface giving more stable readings.
In the case of the lead on an IC chip, a large beam spot may be too large to get several samples on the lead surface. Source: Keyence
Beam Spot Size
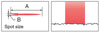
Another important factor to consider when using a laser displacement sensor is beam spot size. When a beam spot strikes a surface, the sensor usually takes an average height measurement on the area covered by the beam spot.Beams spots can range in size from 2 to 2,000 microns. Generally, laser displacement sensor manufacturers will offer lasers with two types of spot size, small and large. A small spot can be round or oval and is useful when profiling small shapes and grooves where a larger beam spot will not fit. Larger beam spots are used on rough surfaces in order to get a more stable reading.
Again, in the case of the lead on an IC chip, a large beam spot may be too large to get several samples on the lead surface.
Larger beam spots are used on rough surfaces in order to get a more stable reading. Source: Keyence
Sum of Variables
Understanding how to balance sampling rate, number of averages and beam spot size is useful when determining what and how much information is gathered per measurement. By knowing the rate of travel and the nature of the target, the operator can optimize the measuring process. If the part moves too fast, the sensor will not have enough time to gather enough useful samples on a particular feature of interest, such as a peak or valley.Some simple calculations can be done based on the sampling rate, beam spot size and rate of travel. After these variables are examined, operators have a better idea of where to set the number of averages to get a more stable reading.
Let’s examine the IC leads again to measure coplanarity. We’ll need to make some basic assumptions.
The main issue will be gathering meaningful data from the surface of the leads. To begin with, operators need to determine how much time is available for the sensor to gather information based on the rate of travel of the material. The pins are 0.025 inch wide and the material is moving at 60 feet per minute. From this data one can calculate that the surface can be seen by the sensor for roughly two milliseconds.
Second, one can determine how many samples the sensor can take in this time period. We know the sensor samples at 5 kHz. Again, doing the math, one would come up with about 10 samples. Here is where knowledge of moving averages kicks in. If the number of averages is set to number higher than 10, one will include the influence of the gap between pins. If the value is set to exactly 10, one will include information from one of the gaps. Suppose the number of averages is set to 4. Operators then would have to wait until five samples were taken on the pin to eliminate the influence of the gap between pins. Therefore one could expect to see about five measurements (10 – 5 = 5) on the pin. With a higher number of averages taken, the reading will be more repeatable, but less measurements can be taken.
One more important feature to note is the beam spot size. If the beam spot is 1 mil, and the width of a pin is 25 mil, because the operator is only taking 10 samples on the pin, they are only covering 10 mil of the 25 mil width available. They would not be able to measure small defects. The beam spot may miss them. Operators would either have to slow the target or increase the sampling rate.
Utilizing options built in to most laser displacement sensors can make the difference between an effective tool and wasted effort. Realizing features such as sampling rate, the number of averages, beam spot size and rate of travel of the target have to be taken into consideration when applying a laser displacement sensor correctly. Here we briefly touched on an example where all of the features play a role. V&S
Moving Average
By using the moving average method, much more usable data is obtained from the target surface giving more stable readings. Source: Keyence
By using the moving average method, much more usable data is obtained from the target surface giving more stable readings. Source: Keyence
Tech Tips
Looking for a reprint of this article?
From high-res PDFs to custom plaques, order your copy today!


