Light Intensity
Specifying LED lighting intensity for machine vision is an important task.
Historically, the primary goal for machine vision lighting has been to provide maximum intensity for minimum initial cost. To achieve this goal, early vision lights typically comprised simple commercial-grade incandescent or fluorescent white light sources. In the late 1980s quartz-halogen based fiber-optic and high-frequency fluorescent lights, specifically designed for vision applications, replaced those early simple sources and provided for a more stable and controlled lighting environment. The commercial practice of specifying light intensity in photometric units, based on various models, was used and has persisted to this day, even after the introduction of monochrome LED-based vision lighting in the mid 1990s. This practice is largely unsuitable, however, for monochrome LED-based vision lights.
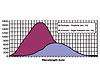
Light output, variously expressed as brightness, flux, intensity or power, is measured by two primary techniques: photometry and radiometry. Photometric measurements of light intensity are wavelength weighted and express light “intensity” as perceived by the human eye. Conversely, radiometric measurements are not weighted, and thus objectively express the power, or energy output, of the light source in linear fashion. For example, the human visual system is most sensitive to yellow-green light at 555 nanometers under normal daylight, or photopic vision. Thus, if expressed photometrically, apparent light intensity of the same radiant power at any other wavelength appears as less “bright” to a human observer.
Additionally, it is important to define precisely what property of light source output is measured and expressed, and to understand the assumptions implied for each type of model. In other words, should one model a spherical or directional (angular) source? Should one measure the source output directly or measure light incident on an object? Should distance from the source be incorporated?
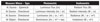
Each of these model types is measured and expressed with different units. For example, light output of spherical sources, such as stars or incandescent bulbs, is often expressed in luminous or radiant flux. Directional sources can be measured taking into account the solid-angle (expressed in steradians), by including source distance (luminance or radiance) or excluding it (luminous or radiant intensity). Luminance and radiance measurements have the advantage of being source-to-object distance independent.
With the exception of illuminance and irradiance measurements, the type models express intensity as measured at the light source, rather than as light incident at the surface of an object being illuminated. Illuminance and irradiance measurements express flux density, and more accurately model LED light sources used in machine vision because they express intensity as measured from a specified area on an illuminated surface from a multi-point, multi-directional source. However, unlike luminance and radiance, these measurements are distance-dependent because flux density is inversely proportional to source-object distances.
 What method, then, is the most appropriate way to measure machine vision light source intensity when it would appear that luminance and radiance are distance-independent, but model the source intensity directly, whereas illuminance and irradiance better model machine vision lighting sources, but have the disadvantage of being distance-dependent? The optimal solution is to express illuminance and irradiance values measured at a specified working distance. This procedure allows for standard conditions to be reproduced, and makes for a more consistent comparison. However, it is still necessary to determine which intensity measurement technique, photometric or radiometric, is more appropriate for the new, non-white (monochrome) LED vision sources available today.
Light intensity can be measured by either weighting (photometric) or not weighting (radiometric) measured intensity data for human vision. The data can be expressed via several models, many of which reflect measurements of the source directly, rather than the light incident on an object. For comparing the light output of monochrome LEDs in machine vision lights, the most appropriate method is to measure light intensity modeled after a direct, multi-point source, incident on the object, at a stated working distance, expressed in radiometric power terms-irradiance (W / m²). For white light, irradiance or its photometric, weighted equivalent, illuminance (lux) is acceptable.
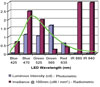 An example best illustrates the lighting differences. This figure plots intensity data of several commercially available standard 5 millimeter lensed monochrome (non-white) LEDs, expressed in photometric and radiometric units, including two wavelengths each for blue, green and IR, and one choice for red. Review of the photometric data would suggest that the “brightest” LED to purchase for constructing an LED vision light is the green 565 nanometer, and that the others would appear to be unsatisfactory choices. However, the radiometric data plots illustrate strikingly different results.
In contrast to the wavelength-weighted photometric measures, the radiometric data would suggest that the green 565 nanometer LED is the least intense, and thus the poorest choice, and that the shorter wavelength green and blue LEDs are more appropriate choices. As might be expected, because the human eye cannot collect IR light, the photometric data read “0” for these LEDs, but in reality their radiometric power is very high. Finally, if the charge-coupled device (CCD) sensor sensitivity plot is superimposed over the wavelength range, the 535 nanometer green and 470 nanometer blue LEDs produce the most useable power for a typical machine vision light, taking fullest advantage of the entire vision system.
Relative sensitivity and range of the human visual system is seen in daytime and night-adapted. Source: Advanced Illumination
Historically, the primary goal for machine vision lighting has been to provide maximum intensity for minimum initial cost. To achieve this goal, early vision lights typically comprised simple commercial-grade incandescent or fluorescent white light sources. In the late 1980s quartz-halogen based fiber-optic and high-frequency fluorescent lights, specifically designed for vision applications, replaced those early simple sources and provided for a more stable and controlled lighting environment. The commercial practice of specifying light intensity in photometric units, based on various models, was used and has persisted to this day, even after the introduction of monochrome LED-based vision lighting in the mid 1990s. This practice is largely unsuitable, however, for monochrome LED-based vision lights.
Light output, variously expressed as brightness, flux, intensity or power, is measured by two primary techniques: photometry and radiometry. Photometric measurements of light intensity are wavelength weighted and express light “intensity” as perceived by the human eye. Conversely, radiometric measurements are not weighted, and thus objectively express the power, or energy output, of the light source in linear fashion. For example, the human visual system is most sensitive to yellow-green light at 555 nanometers under normal daylight, or photopic vision. Thus, if expressed photometrically, apparent light intensity of the same radiant power at any other wavelength appears as less “bright” to a human observer.
Additionally, it is important to define precisely what property of light source output is measured and expressed, and to understand the assumptions implied for each type of model. In other words, should one model a spherical or directional (angular) source? Should one measure the source output directly or measure light incident on an object? Should distance from the source be incorporated?
Each of these model types is measured and expressed with different units. For example, light output of spherical sources, such as stars or incandescent bulbs, is often expressed in luminous or radiant flux. Directional sources can be measured taking into account the solid-angle (expressed in steradians), by including source distance (luminance or radiance) or excluding it (luminous or radiant intensity). Luminance and radiance measurements have the advantage of being source-to-object distance independent.
With the exception of illuminance and irradiance measurements, the type models express intensity as measured at the light source, rather than as light incident at the surface of an object being illuminated. Illuminance and irradiance measurements express flux density, and more accurately model LED light sources used in machine vision because they express intensity as measured from a specified area on an illuminated surface from a multi-point, multi-directional source. However, unlike luminance and radiance, these measurements are distance-dependent because flux density is inversely proportional to source-object distances.
Model type and intensity measurement techniques (sr - steradians, lm – lumens, W – Watts). Source: Advanced Illumination
Light intensity can be measured by either weighting (photometric) or not weighting (radiometric) measured intensity data for human vision. The data can be expressed via several models, many of which reflect measurements of the source directly, rather than the light incident on an object. For comparing the light output of monochrome LEDs in machine vision lights, the most appropriate method is to measure light intensity modeled after a direct, multi-point source, incident on the object, at a stated working distance, expressed in radiometric power terms-irradiance (W / m²). For white light, irradiance or its photometric, weighted equivalent, illuminance (lux) is acceptable.
Photometric and radiometric intensity data plot of several LEDs; cd – candela (lm / sr). The green plot is a typical CCD sensor quantum efficiency curve. Source: Advanced Illumination
In contrast to the wavelength-weighted photometric measures, the radiometric data would suggest that the green 565 nanometer LED is the least intense, and thus the poorest choice, and that the shorter wavelength green and blue LEDs are more appropriate choices. As might be expected, because the human eye cannot collect IR light, the photometric data read “0” for these LEDs, but in reality their radiometric power is very high. Finally, if the charge-coupled device (CCD) sensor sensitivity plot is superimposed over the wavelength range, the 535 nanometer green and 470 nanometer blue LEDs produce the most useable power for a typical machine vision light, taking fullest advantage of the entire vision system.
Looking for a reprint of this article?
From high-res PDFs to custom plaques, order your copy today!


