Software & Analysis
How to Use Risk Evaluation to Develop a PT Participation Plan
Note: The level of the determining factors is based on the status quo of a laboratory and subjective determination; hence different laboratories may produce varying assessment results.
In the past, proficiency testing (PT) items and participation frequency were formulated by accreditation bodies, regardless of the scale, customer type, and economic conditions of a laboratory. In 2010, ILAC P9 began requiring the applicant laboratories considering needs and risk level to make their own PT participation plan (hereafter referred as the PT plan, for short), as long as the PT program was feasible both logistically and economically. The accreditation organization should not only define the minimum requirements for PT participation, but also review whether the PT plan of the laboratory is consistent with the scope of accreditation and provide the necessary guidance. In response to the requirements of ILAC P9, Taiwan Accreditation Foundation (TAF) revised the accreditation criteria document, Requirements for PT Activities (TAF-CNLA-R05). Submitting a PT plan prepared by the laboratory seeking accreditation is required in this revised document. To facilitate applicants learning how to make a plan and implement thereafter, a document—Guidelines for Establishing Plans of Participation in PT Programs (TAF-CNLA-G29)—was developed by TAF based on the concept of risk evaluation.
This article will take one particular case study from TAF-CNLA-G29 to illustrate how to put the risk assessment concepts into the consideration points, formulation procedure, and subsequent review and amendment procedures of the PT plan.
Key Considerations and Implementation Procedures in the Formulation of the PT Plan
Not all testing activities have available corresponding PT programs for participation; hence, in consideration of the supply and economic costs, the laboratory may classify sub-disciplines based on the measurement techniques, measurement properties, and product types. After a sub-discipline has been determined, the laboratory may formulate the minimum frequency of PT participation for each respective sub-discipline based on the level of risk involved. As for the acceptable level of risk of the laboratory, the following factors, as mentioned in EA-4/18, may be included for consideration:
- Integrity of the quality control/assurance measures
- Number of tests undertaken
- Turnover of technical staff
- Experience and knowledge of technical staff
- Source of Traceability (e.g. availability of reference materials, national standards, etc.)
- Known stability/instability of the measurement technique
- Significance and final use of testing data
Case Study of PT Plan
In general, a laboratory possessing the required technical competence would undertake to classify sub-disciplines and encounter no serious problems in the process; the difficulty lies in the acquiring of a balance between supply and cost considerations and in reducing risks down to a minimum. Risk assessment is defined as a quantification of the various consequential effects and losses of a particular risk event after its occurrence. The assessment procedure shall cover the following aspects:
- Risk features: probability of occurrence, duration of the risk, and key risk points;
- Mode of action: direct or indirect effects (range)
- Consequences of risk occurrence: losses and benefits
The more commonly used risk assessment methods include the following: knowledge-based analysis method, model-based analysis method, qualitative analysis, and quantitative analysis. The following case study, a laboratory engaging in the chemical testing of metals, and food products, employs the qualitative risk analysis method, and different ratings are given based on the existing conditions of the respective factors for consideration. Thereafter, the level of risk involved is determined based on the risk matrices, and pursuant to which, the imperativeness and frequency of PT participation are determined.
TECH TIPS
|
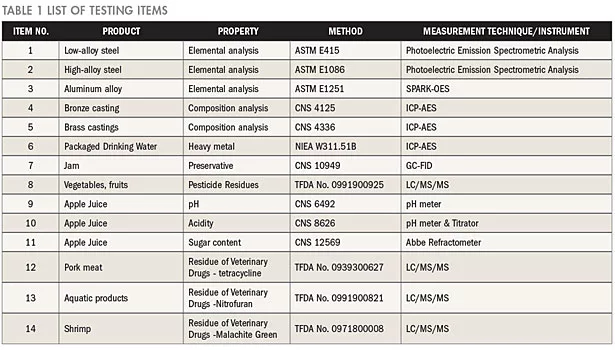
Prepare a list of the testing items
The list should include, at the least, the accredited items and items to be accredited of the laboratory. Enumerate the items to be tested—products, testing properties or parameters, testing methods, and measurement techniques/instruments as shown in Table 1.
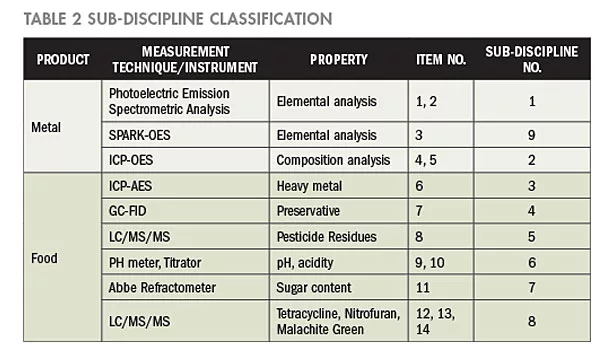
Determine the sub-disciplines
Classify the sub-discipline based on the respective measurement techniques, testing properties, and differences of the products to be tested; and provide technical bases for classification.
In the aforementioned 14 test items, the measurement techniques employed for testing metals include the Photoelectric Emission Spectrometric Analysis, SPARK-OES, and ICP-AES. According to the differences and similarities of the measurement techniques, the five accredited items may be classified into three sub-disciplines for metal products. For food products, nine accredited items are categorized into six sub-disciplines. Thus, a total of 14 sub-disciplines are classified and presented in Table 2.
Principles for setting the level of risk
The level of risk for the following six key points—integrity of the quality control/assurance measures, turnover of technical staff, experience and knowledge of technical staff, source of traceability, known stability/instability of the measurement technique, and significance and final use of testing data are respectively considered in the beginning, and then the classification of the probabilities of occurrence, that is, the frequency of testing undertaken is defined. After determining the foregoing two types of indices, the table of risk matrices is used to determine the level of risk.
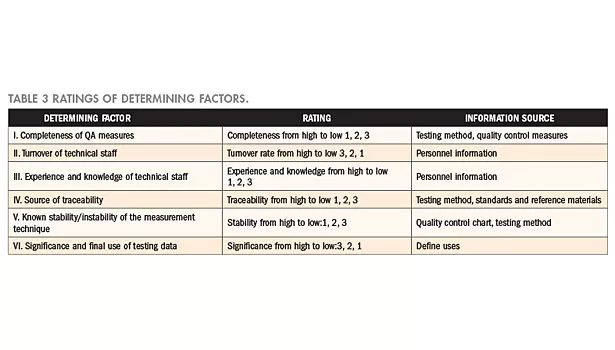
Ratings of determining factors
Six factors from Table 3 serve as the items for consideration in determining the level of risk. A level is assigned to every item on subjective consideration of the existing conditions and records of the laboratory; levels are ranked from excellent to poor, expressed in ratings from 1 to 3. Generally, when a quality control measure is complete, risk is low; and when the turnover rate of technical staff is high, it means that technique could not be accumulated and, thus, the risk level is high. Moreover, risk is naturally high when the technical staff does not possess sufficient experience and knowledge; when reference materials are not easily obtained or when no accredited calibration laboratory is available, traceability will be affected. On the other hand, when the measurement results are affected by the actions of the operating staff, it means that the measurement techniques are unstable; and when the testing report is often used in litigations, it means that risk is extremely high. The respective determining factors, levels, and the corresponding data sources of the laboratory are as tabulated in Table 3.
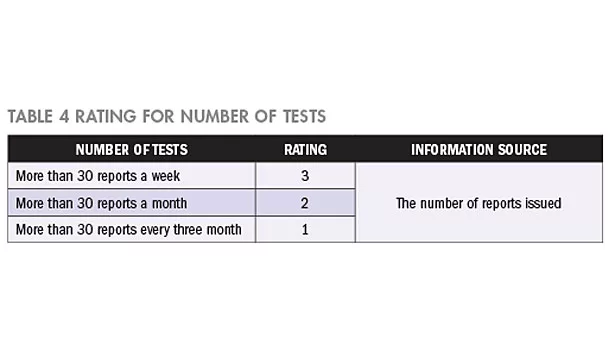
Number of tests undertaken
The number of tests undertaken and the level of risk will not be directly proportional. If the testing technique used is complicated, and the laboratory staff did not have the chance to practice, the technique, and therefore, the number of tests undertaken, is low and means that risk is high. However, if the testing technique is simple, and the laboratory staff is familiar with the technique and the number of tests is high, this means that there would be more reports available and the probability of risk occurrence would escalate. Here, we take the latter for example; the number of the tests undertaken would be expressed in the order of 1, 2, and 3 based on the quantity of the reports produced. The level and frequency of testing are as shown in Table 4.
Level of risk
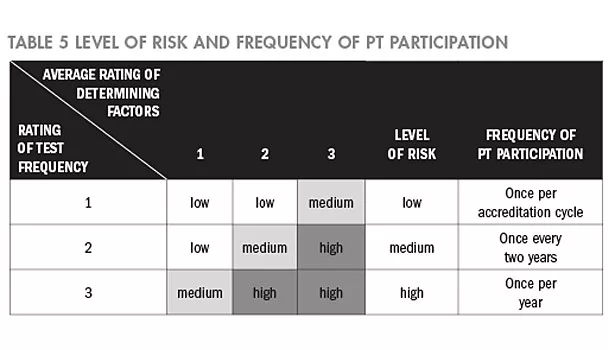
Based on the average rating of the determining factors and the frequency of testing, the risk matrices are used to determine the level of risk; the risks are classified in three levels—high, medium, and low. Since the cycle of accreditation is three years, based on the rated level of risk—high, medium, or low—the PT participation frequency is set from once a year to once in three years, as shown in Table 5.
Procedure of estimating the level of risk
Determine the level of determining factors: Based on the items tabulated on Table 3, a review is conducted on the sub-discipline data. Next, determine the level of each factor and sum up the levels of the six determining factors and, thereafter, obtain the respective averages (rounding off shall be applied to achieve whole numbers).
Determine the rating of testing frequency: The frequency of tests may be obtained based on the number of reports issued per year, and then, based on Table 4, rating may be obtained.
Obtain the level of risk: Average-rating of the determining factors and the rating of testing frequency are introduced into Table 5 to obtain the level of risk of a particular sub-discipline.
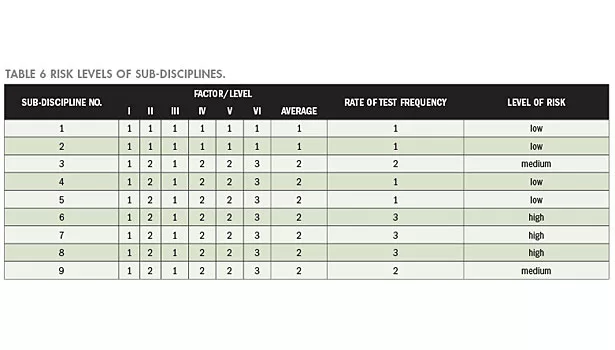
Assessing the level of risk of a sub-discipline
Level of risk of a sub-discipline is assessed based on the foregoing data review; results obtained are shown in Table 6.
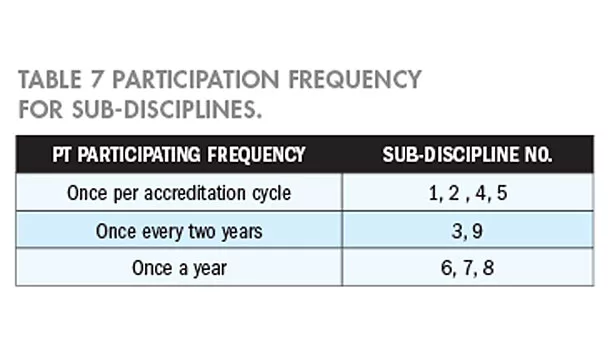
According to the risk evaluation results, the participation frequencies for sub-discipline are summarized in Table 7.
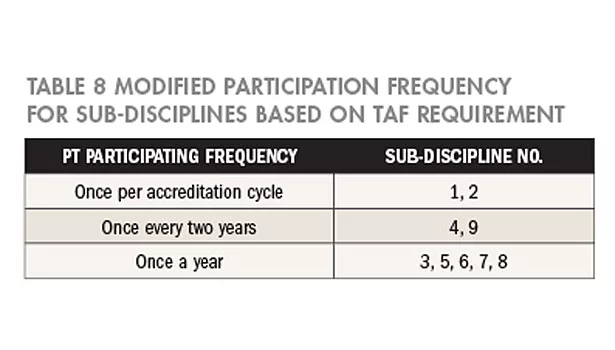
Since TAF has specified the minimum requirements for designated items and the frequency of participation in TAF-CNLA-R05, the frequency of participation is modified accordingly. If the frequency determined based on risk assessment is higher than the requirements in TAF-CNLA-R05, the determined frequency shall be observed; however, if the frequency is lower than the requirement, frequency should be modified. Pertaining results are as shown in Table 8. Modified items are underlined.
Defining the schedule of the PT plan
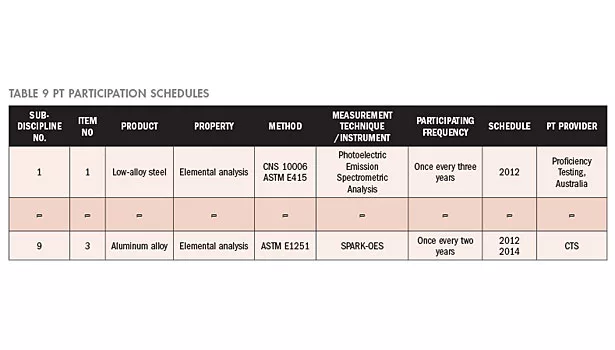
The accreditation period of the laboratory is from 1/2/2012 to 1/1/2015. The PT plan of the laboratory shall be formulated within this accreditation period. Moreover, a search for PT providers shall be conducted pursuant to the TAF-CNLA-R05 information and website data. In accordance with the assessment of the risk level and the TAF-CNLA-R05 requirement, the PT participation time schedules and PT providers for the next three years are as shown in Table 9. Because of limited space, only two items are enumerated.
Review the PT plan regularly and revise timely
Based on the PDCA principles, and considering the changes in the scope of accreditation, regulatory requirements, and level of risk factors, the laboratory may conduct a review, usually together with the management review meeting, to see whether the plan should be modified.
Conclusion
Referring to the preceding case study, a laboratory staff familiar with the testing techniques and laboratory operation could easily conduct a risk assessment of the related factors based on the level of significance of its effects on the measurement results, and then follow the PT participation requirements of the accreditation organization to establish a PT plan suited to the particular needs of the laboratory.
Under the same principle, the accreditation organization may employ risk assessment concepts to define the minimum requirements for the PT participation item and frequency of the accredited laboratory. For instance, TAF, pursuant to the accreditation risk assessment, defines that the frequency shall be set at once a year for items that involve food product for direct oral ingestion that may immediately affect the human body. If items involve product that is taken through skin contact or oral ingestion, and would require a long period of accumulation before it may affect the human body, the frequency shall be set at once in two years. When no evidence of direct effects on human health is determined, participating once within an accreditation cycle shall be required. This way, the accreditation organization may maintain a grasp of the conditions under which a laboratory maintains its technical competence and the laboratory need not waste its resources in participating in unnecessary PT programs.
Looking for a reprint of this article?
From high-res PDFs to custom plaques, order your copy today!


