Sponsored Content
Lehigh Valley Health Network Reduces Length of Stay with Minitab
Two adjacent hospitals merged and grew patient volume by 40% on their Medical/Surgical and Cardiac units. To manage the increase, the project team at LVHN investigated opportunities to improve patient flow and staff satisfaction.

Lehigh Valley Health Network (LVHN) has achieved Quality Milestones throughout its 100+ year history. Its quality journey has recently added Lean Six Sigma tools and Minitab statistical analysis software to help achieve improvements with patient-centered care.
A project team including the Chief Medical Officer, VP of Patient Care Services, Director of Care Management, Director of Medical Surgical Services, two units’ Nurse Managers, front-line unit nurses, Care Management staff and a Black Belt from the Organizational Effectiveness team used Minitab in their improvement effort.

The Challenge
Two adjacent hospitals merged and grew patient volume by 40% on their Medical/Surgical and Cardiac units. To manage the increase, the project team at LVHN investigated opportunities to improve patient flow and staff satisfaction. About 550 patients per month were being discharged between the two units.
How Minitab Helped
The LVHN project team discovered a consistent challenge during similar hours of the day when they examined their data over a 14-month period. With Minitab’s Dotplot shown in Figure 1 below, they were able to see that 95% of discharges and 57% of admissions happened between 10 a.m. and 8 p.m.
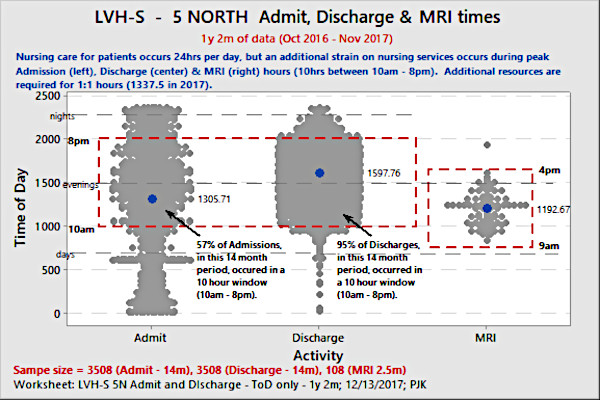
Figure 1: A Minitab Dotplot for Time of Day for Admissions & Discharges (over 14 months of patients), showed a crucial 10-hour window. (Click on the image to enlarge.)
“You show this to any nurse in the world and they’ll probably say, ‘So what? We know this. We live this,’” said Paul Kelly, the Black Belt on the project team. “But it was a turning point for us because they saw the data I was seeing and visually they could confirm, ‘Wow, this is a really important part of our day where we have to be at our most efficient. We’ve got a lot of traffic coming in these 10 hours. We’re not only discharging 95% of patients. We’re doing over half our admissions during those hours and on top of that we’re caring for patients.’”
What could the team deploy that could better manage these “rush hours” for unit staff? Initially, Length of Stay (LOS) data was presented for 57 different discharge locations, as shown in Figure 2 below with length of stay on the y-axis and discharge codes on the x-axis. The team wanted to simplify this, and Minitab’s recoding functionality made the LOS data much easier to interpret.

Figure 2: Fifty-seven different discharge locations LOS. (Click on the image to enlarge.)
When they recoded the 57 discharge locations into three groups, as seen in Figure 3 below, the team asked themselves: Should they focus on the higher LOS discharge locations or where more patients were being discharged to? More patients were discharged to their homes, but their LOS was the lowest of the three groups, so may have less impact overall. Highest LOS were discharges to Skilled Nursing Facilities (SNF), but the number of patient discharges to Skilled Nursing Facilities were lower.
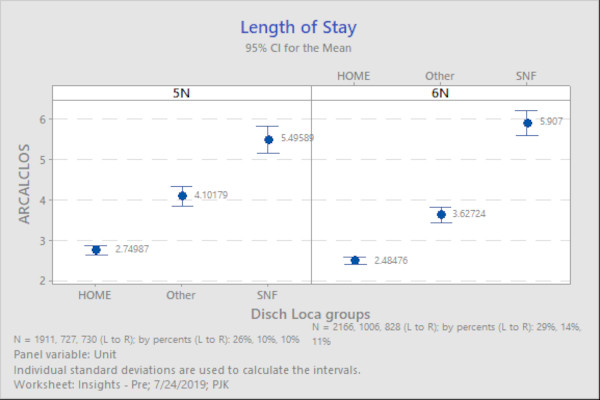
Figure 3: Minitab’s recoding of 57 discharge locations, reduced to three (for two units shown) provided a simpler, more easily understood view of LOS by discharge locations. (Click on the image to enlarge.)
Results
LVHN’s solution targeted all discharge locations, because they thought a once-deployed solution in the past could be useful again. Nursing management deployed two Admission/Discharge Registered Nurses (RNs) to assist nurse colleagues who had direct patient care responsibility with their admissions and discharges.
Over a 13-month period, the Admission/Discharge RNs performed 30% of all admissions and discharges on two units. This off-loading of value-added work allowed admissions and discharges to take place earlier for patients.
Minitab’s Histogram was the primary visual method to keep track of progress and if gains were sustained. The latest discharge times, from 6 p.m. to midnight, were of most interest to the team to reduce. Recoding 24 hours in the day to four 6-hour groups allowed the team to track the change in earlier-in-the-day discharges (see Figure 4).
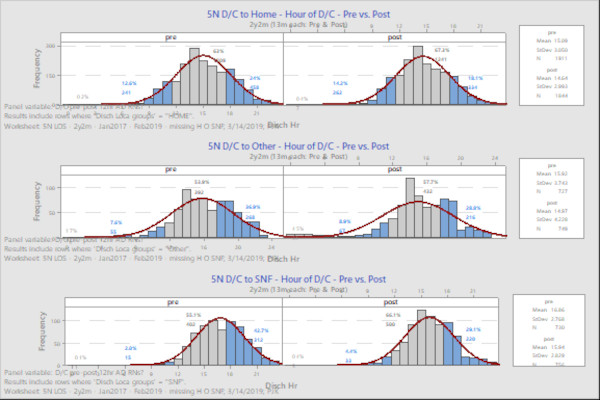
Figure 4: Discharges to Home (top row), Other (middle row) and Skilled Nursing Facilities (bottom row), 13 months before (left column) A/D RNs use and 13 months after (right column) A/D RNs use. NOTE: Y-axis is the number of patients discharged in that hour of day, the x-axis is the hour of day for discharges. (Click on the image to enlarge.)
They observed the largest improvement – 13.6% – with discharges to SNFs during the last 6 hours of the day coming down from 42.7% to 29.1%. Home and Other discharge categories also saw reductions in late discharges:
|
Discharge Location |
Before start of Admission/Discharge RNs assisting units
|
After start of Admission/Discharge RNs assisting units
|
Reduction in Discharges (%) during 6pm to 12am from Before A/D RNs use to After
|
|
Skilled Nursing Facilities |
42.7% |
29.1% |
-13.6% |
|
Other |
36.9% |
28.8% |
-8.1% |
|
Home |
24% |
18.1% |
-5.9% |
Minitab’s quality tools including the Dotplot, Boxplot, Interval Plot and Histogram all contributed to the LVHN team’s selecting an area for improvement and validation of the effectiveness of the solution over time.
This account was adapted from a presentation given during the Minitab’s 2019 Insights Conference in Leesburg, Virginia. To learn more about how Minitab can help your organization’s quality improvement program, visit our website.
Looking for a reprint of this article?
From high-res PDFs to custom plaques, order your copy today!


