50 Years of Quality: A Superficial History of Surface Finish
Any number of influences can leave their mark on the surface of a part. The result is a microscopic maze of etchings that detail the history of a part’s manufacture.
Engineered surfaces need specific characteristics in order to perform as desired. Surface measurement evaluates those characteristics and helps control the manufacturing processes to ensure that the surface will function as desired.
It is said that the “height of superficiality” is to look only at the surface of something. Yet, the topography of an engineered surface can get surprisingly complex. Any number of influences can leave their mark on the surface of a part, from the cutting tools and abrasives that finish it, to the chucks and fixtures that hold it, the machine tools that spin and shape it, and even to things such as vibrations from nearby machines or processes. The result, even on a highly polished surface, is a microscopic maze of etchings that, if properly read, detail the history of a part’s manufacture.
Developing the ability to properly read surface characteristics has been the challenge of metrologists and gage manufacturers for nearly a century, a challenge that continues today.
These early pioneers in the study of friction did not yet have the means to quantify the characteristics of the surfaces in order to understand the role that the microscopic structures on the surfaces played in their function.
But it was the industrial revolution that really sparked the need for a means to measure surface texture and accurately quantify it. The earliest surface measurement devices were reference surfaces machined to various degrees of roughness. Machinists would literally scratch the surface of their parts with their thumbnail and compare them with the reference. Using this method, a good operator could replicate surface finish reasonably well, but the process was a simple go/no-go procedure. No data was gathered and no mathematical analysis conducted. In addition, since there was no means of actually quantifying a surface, the standards themselves were subjective.
There followed a concerted effort to better understand the role of surface texture and to quantify it in ways that were meaningful to manufacturing. Initially, optical microscopes were employed to provide a magnified view of surface characteristics. Again, measurement was comparative and somewhat subjective, but the various degrees of magnification and the differing fields of view afforded led to the concept of sampling lengths and frequency that are central to surface analysis today. Other early efforts to capture information about a surface utilized a trace stylus and a mechanical “amplifier” which used linkage to replicate the trace onto a smoked glass surface.
In 1933, E. J. Abbot developed what is widely believed to have been the first analog surface instrument. This used a stylus to contact the part and provided an actual number to quantify texture. Abbot also co-developed the Abbot-Firestone curve. This used a simple curve to represent the surface and made contact area the basis of the curve, allowing the calculation of a material-to-air ratio as a function of depth. This was the first instrument to link form with function in a numerical manner simple enough to quantify a surface and help control manufacturing processes.
The single largest event to change how surfaces are measured was yet to come however. The digital revolution allowed us to create instruments that digitize the analog signal from the stylus, and generate the typical surface profile trace we are familiar with today.
With the profile in hand it became possible to apply mathematical tools to analyze a variety of profile characteristics. Today there are literally hundreds of different ways to analyze surface characteristics, some codified into national and international standards, others specific to various industries or even individual companies. Moreover, analysis of two-dimensional (2-D) digital profiles has gone way beyond simple mathematical averages, and it is now possible to compute sophisticated functional characteristics, such as the ability of surfaces to bear loads, retain lubrication, seal against leaks, and even support the growth and attachment of human bone.
Digitization also is blurring the lines between what was once considered surface measurement and part geometry. Metrologists today often categorize the data from a measured surface into three categories-roughness, waviness and form.
Shorter wavelength data tends to reflect surface roughness characteristics imposed by machining operations, such as turning, grinding or polishing. Waviness involves longer wavelength data and might reflect instabilities in the machining process, such as imbalance in a grinding wheel or worn spindle bearings. Long wavelength data tends to reflect errors, such as lack of straightness in the guideways of a machine or misalignment of machine axes.
These long wavelength errors are usually thought of as form characteristics, such as roundness, straightness or flatness. Perfect straightness, for example, could be described as a line, or wave, with an amplitude of zero. Furthermore, what is perceived as a short wavelength and what is a long wavelength are now generally understood to vary depending on the size of the part and the intended function of the surface.
In addition, while old analog instruments gathered only the data needed for a specific measurement, modern digital instruments gather a whole spectrum of data from each trace, making subsequent analysis of other wavelengths possible without the need to remeasure the part.
Future developments in surface metrology will no doubt make the process even more important. As microprocessors gain power and the ability to process enormous amounts of data becomes economically feasible, optical systems are coming back into vogue and opening up new avenues of exploration. With optical systems there is the opportunity to measure a surface in three-dimensional (3-D) rather than the typical 2-D measurements made with stylus tracing instruments.
It is generally believed that since surfaces exist in 3-D and function in 3-D, measurement of these surfaces using 3-D instrumentation should allow better linkage between the measurements and the suitability of a surface to perform a desired function. But there is a great deal of work still to be done before this becomes part of the typical surface measurement specification.
Currently there is a lot of research being done with various optical techniques, and it is clear that different technologies measuring the same surface sometimes “see” different things in the structure of the surface.
Work to create standardized measurement and analysis methods for these optically measured surfaces is critical to lay the groundwork for the use of 3-D parameters. So there is more to come on how to properly read a surface, but we are standing on the threshold of the next revolution.
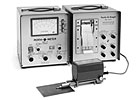
With the ability to trace surface texture came the realization that, within the limitations of a probe or stylus tip and the device used, any part trace would include an amalgam of a nearly infinite number of different frequencies present in the path being traced. These, in turn, reflected characteristics imposed by the manufacturing process. This led in the early 1960s to the development of 2RC filters, a growing number of commercial instruments, and the popularity of basic roughness parameters such as Ra, Rq and Rz. Source: Mahr
Engineered surfaces need specific characteristics in order to perform as desired. Surface measurement evaluates those characteristics and helps control the manufacturing processes to ensure that the surface will function as desired.
It is said that the “height of superficiality” is to look only at the surface of something. Yet, the topography of an engineered surface can get surprisingly complex. Any number of influences can leave their mark on the surface of a part, from the cutting tools and abrasives that finish it, to the chucks and fixtures that hold it, the machine tools that spin and shape it, and even to things such as vibrations from nearby machines or processes. The result, even on a highly polished surface, is a microscopic maze of etchings that, if properly read, detail the history of a part’s manufacture.
Developing the ability to properly read surface characteristics has been the challenge of metrologists and gage manufacturers for nearly a century, a challenge that continues today.
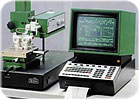
The digital revolution allowed us to create instruments that digitize the analog signal from the stylus and generate the typical surface profile trace we are familiar with today. With the profile in hand it became possible to apply mathematical tools to analyze a wide variety of profile characteristics. Today there are literally hundreds of different ways to analyze surface characteristics. Source: Mahr
Early History
Leonardo da Vinci is credited by some historians with being the father of modern tribology-the science and technology of friction, lubrication and wear. Among his myriad interests, he studied friction, wear, bearing materials, lubrication systems, gears and rolling-element bearings. He is even said to have postulated several rules for the behavior of sliding surfaces under load in his notebooks, which are often credited as the principle influence on the “laws of friction” published by French physicist Guillaume Amontons in 1699 and verified by Charles-Augustin de Coulomb in 1781.These early pioneers in the study of friction did not yet have the means to quantify the characteristics of the surfaces in order to understand the role that the microscopic structures on the surfaces played in their function.
But it was the industrial revolution that really sparked the need for a means to measure surface texture and accurately quantify it. The earliest surface measurement devices were reference surfaces machined to various degrees of roughness. Machinists would literally scratch the surface of their parts with their thumbnail and compare them with the reference. Using this method, a good operator could replicate surface finish reasonably well, but the process was a simple go/no-go procedure. No data was gathered and no mathematical analysis conducted. In addition, since there was no means of actually quantifying a surface, the standards themselves were subjective.
Early Gages
For many years, engineers naively believed that smoother was better. Several events changed this view, one very dramatically. It happened in 1930 when Bentley engines, which were manufactured with exceptionally smooth cylinder walls, seized up during the Le Mans 24-hour race.There followed a concerted effort to better understand the role of surface texture and to quantify it in ways that were meaningful to manufacturing. Initially, optical microscopes were employed to provide a magnified view of surface characteristics. Again, measurement was comparative and somewhat subjective, but the various degrees of magnification and the differing fields of view afforded led to the concept of sampling lengths and frequency that are central to surface analysis today. Other early efforts to capture information about a surface utilized a trace stylus and a mechanical “amplifier” which used linkage to replicate the trace onto a smoked glass surface.
In 1933, E. J. Abbot developed what is widely believed to have been the first analog surface instrument. This used a stylus to contact the part and provided an actual number to quantify texture. Abbot also co-developed the Abbot-Firestone curve. This used a simple curve to represent the surface and made contact area the basis of the curve, allowing the calculation of a material-to-air ratio as a function of depth. This was the first instrument to link form with function in a numerical manner simple enough to quantify a surface and help control manufacturing processes.
Modern Instruments
With the ability to trace surface texture came the realization that, within the limitations of a probe or stylus tip and the device used, any part trace would include an amalgam of a nearly infinite number of different frequencies present in the path being traced. These, in turn, reflected characteristics imposed by the manufacturing process. Just how to segment and analyze this data occasioned much theoretical work during the next decades. This led in the early 1960s to the development of 2RC filters, a growing number of commercial instruments, and the popularity of basic roughness parameters such as Ra, Rq and Rz.The single largest event to change how surfaces are measured was yet to come however. The digital revolution allowed us to create instruments that digitize the analog signal from the stylus, and generate the typical surface profile trace we are familiar with today.
With the profile in hand it became possible to apply mathematical tools to analyze a variety of profile characteristics. Today there are literally hundreds of different ways to analyze surface characteristics, some codified into national and international standards, others specific to various industries or even individual companies. Moreover, analysis of two-dimensional (2-D) digital profiles has gone way beyond simple mathematical averages, and it is now possible to compute sophisticated functional characteristics, such as the ability of surfaces to bear loads, retain lubrication, seal against leaks, and even support the growth and attachment of human bone.
Digitization also is blurring the lines between what was once considered surface measurement and part geometry. Metrologists today often categorize the data from a measured surface into three categories-roughness, waviness and form.
Shorter wavelength data tends to reflect surface roughness characteristics imposed by machining operations, such as turning, grinding or polishing. Waviness involves longer wavelength data and might reflect instabilities in the machining process, such as imbalance in a grinding wheel or worn spindle bearings. Long wavelength data tends to reflect errors, such as lack of straightness in the guideways of a machine or misalignment of machine axes.
These long wavelength errors are usually thought of as form characteristics, such as roundness, straightness or flatness. Perfect straightness, for example, could be described as a line, or wave, with an amplitude of zero. Furthermore, what is perceived as a short wavelength and what is a long wavelength are now generally understood to vary depending on the size of the part and the intended function of the surface.
In addition, while old analog instruments gathered only the data needed for a specific measurement, modern digital instruments gather a whole spectrum of data from each trace, making subsequent analysis of other wavelengths possible without the need to remeasure the part.
Future Dimensions
As dimensional tolerances have grown steadily tighter over the years, and the need for documentation and traceability become ever greater, the role of surface finish measurement in the manufacturing process has grown dramatically. It has been estimated that in the 1940s, the proportion of the tolerance band taken up by surface irregularities was roughly 15%. Today that proportion is sometimes 50% or more for precision components.Future developments in surface metrology will no doubt make the process even more important. As microprocessors gain power and the ability to process enormous amounts of data becomes economically feasible, optical systems are coming back into vogue and opening up new avenues of exploration. With optical systems there is the opportunity to measure a surface in three-dimensional (3-D) rather than the typical 2-D measurements made with stylus tracing instruments.
It is generally believed that since surfaces exist in 3-D and function in 3-D, measurement of these surfaces using 3-D instrumentation should allow better linkage between the measurements and the suitability of a surface to perform a desired function. But there is a great deal of work still to be done before this becomes part of the typical surface measurement specification.
Currently there is a lot of research being done with various optical techniques, and it is clear that different technologies measuring the same surface sometimes “see” different things in the structure of the surface.
Work to create standardized measurement and analysis methods for these optically measured surfaces is critical to lay the groundwork for the use of 3-D parameters. So there is more to come on how to properly read a surface, but we are standing on the threshold of the next revolution.
Looking for a reprint of this article?
From high-res PDFs to custom plaques, order your copy today!


