Quality Magazine logo
search
cart
facebook twitter linkedin youtube
  • Sign In
  • Create Account
  • Sign Out
  • My Account
Quality Magazine logo
  • NEWS
  • PRODUCTS
    • FEATURED PRODUCTS
    • SUBMIT YOUR PRODUCT
  • CHANNELS
    • AUTOMATION
    • MANAGEMENT
    • MEASUREMENT
    • NDT
    • QUALITY 101
    • SOFTWARE
    • TEST & INSPECTION
    • VISION & SENSORS
  • MARKETS
    • AEROSPACE
    • AUTOMOTIVE
    • ENERGY
    • GREEN MANUFACTURING
    • MEDICAL
  • MEDIA
    • A WORD ON QUALITY PUZZLE
    • EBOOK
    • PODCASTS
    • VIDEOS
    • WEBINARS
  • EVENTS
    • EVENT CALENDAR
    • IMTS
  • DIRECTORIES
    • BUYERS GUIDE >
      • Supplier Insights
    • NDT SOURCEBOOK
    • VISION & SENSORS
    • TAKE A TOUR
  • INFOCENTERS
    • Digital Quality Management Systems
    • NEXT GENERATION SPC & QUALITY ANALYTICS
  • AWARDS
    • ROOKIE OF THE YEAR
    • PLANT OF THE YEAR
    • PROFESSIONAL OF THE YEAR
  • MORE
    • Expert Columns
    • NEWSLETTERS
    • QUALITY STORE
    • INDUSTRY LINKS
    • SPONSOR INSIGHTS
  • EMAG
    • eMAGAZINE
    • ARCHIVES
    • CONTACT
    • ADVERTISE
  • SIGN UP!

Quality 101: Moving Range Charts ‘Fix' on Process Behavior

By Dr. Sophronia Ward
December 1, 2004
Control charts help analyze data for improving the manufacturing process.

The analysis of data using process behavior charts-Walter Shewhart called them control charts-is the foundation of statistical process control (SPC) for process improvement. SPC focuses on the concept that all processes have routine variation and some processes have additional variation from exceptions. Process improvement requires eliminating causes of exceptional variation, and reducing the variation from routine causes. Correctly constructed, process behavior charts separate exceptional variation from routine variation and allows a user to focus on identifying and removing exceptions from a process.

A variety of process behavior charts have been developed since Shewhart introduced the average and range chart in 1924. One that is widely used, both in manufacturing operations as well as for management processes, is the individuals and moving range chart.

Two charts in one

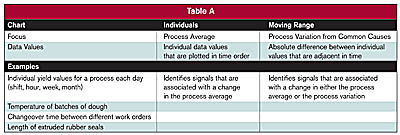
The individuals and moving range chart-XmR or ImR-are really two charts used in tandem. Together they monitor the process average as well as process variation. Table A summarizes the focus of each chart and gives examples of measures that might be analyzed using this method.

Since the individuals (X) chart is a time-ordered sequence of individual data values, it is possible to see all of the variation, routine and exceptional, from the process on this chart. However, the analysis focuses on separating any exceptional variation present in the data from the routine variation of the process. Quantifying the routine variation is the job of the moving ranges.

How mRs quantify routine variation

Each moving range-absolute difference between adjacent data values-reflects the variation between time periods. The average of the moving ranges is then used to calculate the limits: natural process limits (NPL) on the X chart and upper control limits (UCL) on the mR chart.

If a process has only routine variation, the moving ranges, and thus the average of the moving ranges, can be converted to a standard deviation for the process and used to calculate limits on the charts. These control limits are 3 Sigma limits, as recommended by Shewhart, to ensure the economic control of quality of manufactured product.

If a process has both routine variation and exceptional variation, some moving ranges will be inflated by the exceptions. However, many of the moving ranges will consist only of routine variation, and the average moving range will not be drastically inflated. Limits calculated from the average moving range will still be able to detect exceptional causes of variation. In extreme cases, limits may be calculated from the median moving range. This protects against inflation of the limits on the charts.

Formulas for XmR Chart Limits

Caution

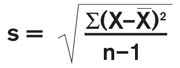
Two cautions must be recognized. The first temptation is to calculate the control limits for the individual values using all of the data in a traditional formula for standard deviation.

This formula is widely used and is included in many software packages. It is not appropriate to use in calculating limits for the XmR chart because it does not distinguish between routine and exceptional variation. If special cause variation is present in the data, limits calculated using "s" will be overly inflated and no signals will appear on the chart. The ability to detect exceptional variation is undermined by the arithmetic.

The second temptation is to use only the X chart. While this may seem practical, some of the analysis may be lost. The mR chart serves to reinforce the X chart by:


SIDEBAR:

A manufacturer of machined components for the aerospace industry needs to predict productivity for the coming year. Productivity values by shift are available for the past 9 production days and are summarized above.

Using the XmR chart, one individual value and one moving range signal the presence of exceptional variation.

To focus only on routine variation of this process to construct control limits, it is appropriate to calculate the limits using an average moving range, (or median moving range) , without the influence of the data points associated with exceptions. A total of four moving ranges were not used in the final calculation of limits. The final chart clearly distinguishes between routine variation and the additional variation in the data from exceptions. Routine variation in this process is the difference in the NPLs: 99.78-58.65=41.13. Based on this analysis, productivity is not predictable and the variation from routine causes is 41%.

Share This Story

Looking for a reprint of this article?
From high-res PDFs to custom plaques, order your copy today!

Qm0620 clmn ask the expert author sophronia ward 0620

Dr. Sophronia Ward, a PhD statistician and continual improvement specialist, has extensive experience in manufacturing, service and health CARE. [email protected], www.pinnaclepartnersinc.com, or (865) 310-2973.

Recommended Content

JOIN TODAY
to unlock your recommendations.

Already have an account? Sign In

  • 2024 Quality Rookie of the Year Justin Wise 1440x750px banner with "Quality Rookie of the Year" logo inset

    Meet the 2024 Quality Rookie of the Year: Justin Wise

    Justin Wise is an exceptional individual who has been...
    Aerospace
    By: Michelle Bangert
  • Man with umbrella and coat stands outside while it rains at night looking at a building.

    Nondestructive Testing: Is there an ethics problem?

    I was a whistleblower who exposed fraudulent activities...
    NDT
    By: Dale Norwood
  • Unraveling Deflategate: Football stadium with closeup of football on field

    Unraveling the Tom Brady Deflategate

    The Deflategate scandal erupted following the 2014 AFC...
    Measurement
    By: Greg Cenker and Henry Zumbrun
Manage My Account
  • eMagazine Subscriptions
  • Newsletters
  • Online Registration
  • Subscription Customer Service
  • Manage My Preferences

More Videos

Sponsored Content

Sponsored Content is a special paid section where industry companies provide high quality, objective, non-commercial content around topics of interest to the Quality audience. All Sponsored Content is supplied by the advertising company and any opinions expressed in this article are those of the author and not necessarily reflect the views of Quality or its parent company, BNP Media. Interested in participating in our Sponsored Content section? Contact your local rep!

close
  • This image shows a person seated next to a Bobcat T66 compact track loader.
    Sponsored byPolyWorks by InnovMetric

    Supercharging Digital Gauging at Bobcat North America

  • Dorsey Calibration Lab photo by Tom LaBarbera Picture this Studios
    Sponsored byDorsey Metrology International

    Ensuring Product Quality in a Competitive Manufacturing Landscape

  • This image displays a Eddyfi Technologies Cypher portable inspection instrument alongside a scanner for non-destructive testing (NDT).
    Sponsored byEddyfi Technologies

    A Safer, Smarter Approach to Weld Inspection: Why Advanced Ultrasonic Testing Is Redefining Industry Standards

Popular Stories

MicroRidge MobileCollect wireless measurement system

Before AI Can Help, the Data Has to Be Ready

a titanium diaphragm speaker driver

The One Thing Elon Gets Right Is Designed to Scare You

This image shows a person seated next to a Bobcat T66 compact track loader.

Supercharging Digital Gauging at Bobcat North America

2026 Quality Professional of the Year!

Events

June 4, 2026

Scaling Manufacturing Quality with Automation for Greater ROI

If you need to do more with the same resources or build a new tech foundation, this session shows where to start and how to create a more efficient, scalable, cost-conscious quality process.

June 9, 2026

Future-Proof your Quality Processes with Advanced 3D Optical CMM Technology

Discover how to effortlessly capture complex data, leverage true multi-sensor automation, and ensure continuous operation without creating inspection delays.

View All Submit An Event

Products

Lean Manufacturing and Service Fundamentals, Applications, and Case Studies

Lean Manufacturing and Service Fundamentals, Applications, and Case Studies

See More Products
Quality Podcast Channel Custom Content

Related Articles

  • Quality 101: Six Sigma: The Power of Understanding Process Behavior

    See More
  • Quality 101: SPC for a Healthy Manufacturing Process

    See More
  • Quality 101: Process Mapping for the 21st Century

    See More

Related Products

See More Products
  • H1457.jpg

    The Certified Quality Process Analyst Handbook, 2E

See More Products

Related Directories

  • FixLogix LLC

    FixLogix produces t-slot style modular part holding systems for CMMs, Optical comparators, vision systems, portables arms, and non-contact scanners. The fixture systems are highly flexible and functional, while also being the most cost-effective system on the market. FixLogix also offers semi dedicated fixturing for quick and easy measuring.
  • Business & Quality Process Management LLC

    BQPM, LLC is a global business and quality management consulting firm that helps small and medium business entities articulate their vision, achieve their goals, and realize their long-term potential. Our team utilizes state-of-the-art, process-based business, quality, website, and graphics methodologies to help management implement best practices and marketing for success.
×

Stay in the know with Quality’s comprehensive coverage of
the manufacturing and metrology industries.

Newsletters | Website | eMagazine

JOIN TODAY!
  • RESOURCES
    • Advertise
    • Contact Us
    • Directories
    • Manufacturing Division
    • Store
    • Want More
  • SIGN UP TODAY
    • Create Account
    • eMagazine
    • Newsletters
    • Customer Service
    • Manage Preferences
  • SERVICES
    • Marketing Services
    • Market Research
    • Reprints
    • List Rental
    • Survey/Respondent Access
  • STAY CONNECTED
    • LinkedIn
    • Facebook
    • YouTube
    • X (Twitter)
  • PRIVACY
    • PRIVACY POLICY
    • TERMS & CONDITIONS
    • DO NOT SELL MY PERSONAL INFORMATION
    • PRIVACY REQUEST
    • ACCESSIBILITY

Copyright ©2026. All Rights Reserved BNP Media, Inc. and BNP Media II, LLC.

Design, CMS, Hosting & Web Development :: ePublishing