Quality Magazine logo
search
cart
facebook twitter linkedin youtube
  • Sign In
  • Create Account
  • Sign Out
  • My Account
Quality Magazine logo
  • NEWS
  • PRODUCTS
    • FEATURED PRODUCTS
    • SUBMIT YOUR PRODUCT
  • CHANNELS
    • AUTOMATION
    • MANAGEMENT
    • MEASUREMENT
    • NDT
    • QUALITY 101
    • SOFTWARE
    • TEST & INSPECTION
    • VISION & SENSORS
  • MARKETS
    • AEROSPACE
    • AUTOMOTIVE
    • ENERGY
    • GREEN MANUFACTURING
    • MEDICAL
  • MEDIA
    • A WORD ON QUALITY PUZZLE
    • EBOOK
    • PODCASTS
    • VIDEOS
    • WEBINARS
  • EVENTS
    • EVENT CALENDAR
    • IMTS
  • DIRECTORIES
    • BUYERS GUIDE >
      • Supplier Insights
    • NDT SOURCEBOOK
    • VISION & SENSORS
    • TAKE A TOUR
  • INFOCENTERS
    • Digital Quality Management Systems
    • NEXT GENERATION SPC & QUALITY ANALYTICS
  • AWARDS
    • ROOKIE OF THE YEAR
    • PLANT OF THE YEAR
    • PROFESSIONAL OF THE YEAR
  • MORE
    • Expert Columns
    • NEWSLETTERS
    • QUALITY STORE
    • INDUSTRY LINKS
    • SPONSOR INSIGHTS
  • EMAG
    • eMAGAZINE
    • ARCHIVES
    • CONTACT
    • ADVERTISE
  • SIGN UP!

Brain Teasers: How Thin Can We Go?

By Dr. Sophronia Ward
January 28, 2009


Anyone who has faced a production problem with a need to solve it by using production data can relate to the notion of a brain teaser. The brain teasers presented here are based on real-world situations encountered by workers in manufacturing environments. The brain teasers have three parts: (1) the situation, (2) available data or other supporting information and (3) questions that various workers need answered for continual improvement. Recommended solutions follow in the next issue and on the Web at Quality Online (www.qualitymag.com).

Situation

Russell has recently assumed the job as manager of his company’s product engineering group. He works with the quality manager, Jake, to ensure that the specifications for all products can be achieved. One high-volume product is a blow-molded container that has multiple layers. The material for one of the layers is very costly and Russell’s boss has requested that the average thickness for this layer be reduced as much as possible. Specifications for the thickness of this layer are 0.2 millimeter ± 0.1 millimeter. Even a reduction of 0.02 millimeter on the average has the potential to reduce the materials costs for this product by as much as $10,000 per month (or $120,000 annually) at current production rates of 50,000 units each month. Russell asked Jake to provide recent thickness data for this layer to determine if the average thickness could be reduced without going out of specification on the low side.

Available data

Jake was unable to find data for the specific product, so he set up a data collection plan to measure the thickness of this critical layer on two containers (one from each cavity in the machine) every two hours. He decided not to collect more data at this point because the measurement is a destructive and time-consuming test. Two days of data are summarized in the table, “Layer Thickness Data.”

Questions

1. What is the current behavior and capability of the thickness of the layer in question based on the data collected for November 5th and 6th?

2. What is the potential for reducing the average thickness for this layer of the product?

3. If Russell recommends that production reduce the average thickness of this layer, what concerns must be addressed to ensure that the thickness meets the minimum specification?


Answers to January Brain Teaser

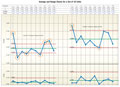
As the supplier quality manager, Carmen monitors critical characteristics of incoming components and materials. Her goal is to accept incoming materials based on data from the supplier, but first she wants to make certain that the measurement processes used by the supplier and her own company give data that agrees. Carmen and one supplier have agreed on a set of samples to use in the measurement study to evaluate the agreement.

Q: Do both the supplier and Carmen’s company have predictable measurement techniques?
A: The data from both the supplier company and Carmen’s company consist of two measurements of each of 10 disks. Using the subgroups of size 2 for the data from Carmen’s company, the range chart shows a predictable amount of measurement variation. The data from the supplier company also shows a predictable amount of measurement variation. In both cases, the average chart shows points outside the control limits, which are based only on measurement process variation or repeatability. When the measurement process variation is small compared to the production process variation, many of the average values of the different units measured are expected to be outside these control limits. See the chart, “Average and Range Charts for a Set of 10 Units.”

Q: What is the standard deviation (repeatability) of each measurement process?
A: For Carmen’s company, the measurement process standard deviation is:

R = 0.03
-     -   = 0.0267
d2 1.128

while the standard deviation of the supplier’s measurement process is:

R = 0.058
-    -   = 0.0514
d2 1.128

Q: Do the two measurement processes give similar results on the thickness values?
A: No, they do not. Carmen’s company has a measurement process that has a standard deviation of 0.0267 while the supplier measurement process has a standard deviation of 0.0514, which is almost twice that of Carmen’s company. Also, the overall average value from Carmen’s company is 2.4840. The overall average value from the supplier is 2.6020 for the same 10 units. The difference in these averages is 0.118.

If the limits from the process behavior chart based on data from Carmen’s company were used with the data from the supplier company, every part average would be outside the upper control limit on the average chart and two of the ranges would be outside the upper control limit on the range chart. This is an indication that the supplier’s measurement technique is detectably different from the technique used by Carmen’s company on both average and variation.

Q: What actions do you recommend Carmen take based on the results of this measurement study?
A: Because there is a detectable difference in both the average result and the variation between the data collected using the supplier’s measurement process and the technique used by Carmen’s company, Carmen needs to determine the causes of these differences and re-run the study. Until both companies get similar answers on the set of test units, Carmen cannot afford to accept shipments from the supplier based on data collected by the supplier.

Share This Story

Looking for a reprint of this article?
From high-res PDFs to custom plaques, order your copy today!

Qm0620 clmn ask the expert author sophronia ward 0620

Dr. Sophronia Ward, a PhD statistician and continual improvement specialist, has extensive experience in manufacturing, service and health CARE. [email protected], www.pinnaclepartnersinc.com, or (865) 310-2973.

Recommended Content

JOIN TODAY
to unlock your recommendations.

Already have an account? Sign In

  • 2024 Quality Rookie of the Year Justin Wise 1440x750px banner with "Quality Rookie of the Year" logo inset

    Meet the 2024 Quality Rookie of the Year: Justin Wise

    Justin Wise is an exceptional individual who has been...
    Aerospace
    By: Michelle Bangert
  • Man with umbrella and coat stands outside while it rains at night looking at a building.

    Nondestructive Testing: Is there an ethics problem?

    I was a whistleblower who exposed fraudulent activities...
    NDT
    By: Dale Norwood
  • Unraveling Deflategate: Football stadium with closeup of football on field

    Unraveling the Tom Brady Deflategate

    The Deflategate scandal erupted following the 2014 AFC...
    Measurement
    By: Greg Cenker and Henry Zumbrun
Manage My Account
  • eMagazine Subscriptions
  • Newsletters
  • Online Registration
  • Subscription Customer Service
  • Manage My Preferences

More Videos

Sponsored Content

Sponsored Content is a special paid section where industry companies provide high quality, objective, non-commercial content around topics of interest to the Quality audience. All Sponsored Content is supplied by the advertising company and any opinions expressed in this article are those of the author and not necessarily reflect the views of Quality or its parent company, BNP Media. Interested in participating in our Sponsored Content section? Contact your local rep!

close
  • Key Takeaways for Quality Leaders
    Sponsored byComplianceQuest

    Key Takeaways for Quality Leaders from the 2026 Gartner Magic Quadrant™ for QMS

  • This image shows a person seated next to a Bobcat T66 compact track loader.
    Sponsored byPolyWorks by InnovMetric

    Supercharging Digital Gauging at Bobcat North America

  • Dorsey Calibration Lab photo by Tom LaBarbera Picture this Studios
    Sponsored byDorsey Metrology International

    Ensuring Product Quality in a Competitive Manufacturing Landscape

Popular Stories

a titanium diaphragm speaker driver

The One Thing Elon Gets Right Is Designed to Scare You

This image shows a person seated next to a Bobcat T66 compact track loader.

Supercharging Digital Gauging at Bobcat North America

Dorsey Calibration Lab photo by Tom LaBarbera Picture this Studios

Ensuring Product Quality in a Competitive Manufacturing Landscape

2026 Quality Professional of the Year!

Events

June 9, 2026

Future-Proof your Quality Processes with Advanced 3D Optical CMM Technology

Discover how to effortlessly capture complex data, leverage true multi-sensor automation, and ensure continuous operation without creating inspection delays.

June 22, 2026

Automate 2026

Automate is North America's largest robotics and automation event — and the best place to take your ideas from insight to impact.
 
Our show floor features the world’s leading automation solutions, from AI and robotics to motion control, vision systems, and more. Plus, our educational conference is second to none, led by the brightest minds in automation today.
 
Ready to transform the way you work? Take the next step at Automate.
View All Submit An Event

Products

Lean Manufacturing and Service Fundamentals, Applications, and Case Studies

Lean Manufacturing and Service Fundamentals, Applications, and Case Studies

See More Products
Quality Podcast Channel Custom Content

Related Articles

  • Brain Teasers: How Six Sigma Helps a Lean Project

    See More
  • Brain Teasers: Can You Solve the Final Brain Teaser?

    See More
  • Brain Teasers: Can Design Processes be Improved?

    See More

Related Products

See More Products
  • Quality Brain Teasers: Real World Challenges to Build Your Manufacturing Skills (ebook)

  • image.jpg

    Management Lessons from Taiichi Ohno: What Every Leader Can Learn from the Man who Invented the Toyota Production System

See More Products

Events

View AllSubmit An Event
  • June 24, 2025

    From Compliance Chaos to Certification Confidence: How QA Teams Can Win Audits With the Right Systems & Partners

    On Demand Audits don’t have to be stressful. In this session, you'll learn how to confidently prepare for ISO and regulatory audits by understanding the distinct roles of certification bodies and implementation partners.
View AllSubmit An Event
×

Stay in the know with Quality’s comprehensive coverage of
the manufacturing and metrology industries.

Newsletters | Website | eMagazine

JOIN TODAY!
  • RESOURCES
    • Advertise
    • Contact Us
    • Directories
    • Manufacturing Division
    • Store
    • Want More
  • SIGN UP TODAY
    • Create Account
    • eMagazine
    • Newsletters
    • Customer Service
    • Manage Preferences
  • SERVICES
    • Marketing Services
    • Market Research
    • Reprints
    • List Rental
    • Survey/Respondent Access
  • STAY CONNECTED
    • LinkedIn
    • Facebook
    • YouTube
    • X (Twitter)
  • PRIVACY
    • PRIVACY POLICY
    • TERMS & CONDITIONS
    • DO NOT SELL MY PERSONAL INFORMATION
    • PRIVACY REQUEST
    • ACCESSIBILITY

Copyright ©2026. All Rights Reserved BNP Media, Inc. and BNP Media II, LLC.

Design, CMS, Hosting & Web Development :: ePublishing