Brain Teasers: How Six Sigma Helps a Lean Project

Anyone who has faced a production problem with a need to solve it by using production data can relate to the notion of a brain teaser. The brain teasers presented here are based on real-world situations encountered by workers in manufacturing environments. The brain teasers have three parts: (1) the situation, (2) available data or other supporting information and (3) questions that various workers need answered for continual improvement. Recommended solutions follow in the next issue and on the Web at Quality Online (www.qualitymag.com).
Situation
Kirk is a production supervisor for a company that makes injection molded plastic containers for the cosmetic industry. His company has embarked on both lean and Six Sigma initiatives. One lean project focused on reducing color change over time for small containers on Kirk's two plastic container lines. One line was dedicated to a single size and type of container. The other line made containers in three different sizes and several different shapes. Both lines produce 10 containers in a single round. Prior to the project, all color changes required that the line shut down and drain excess material before introducing the new color. The result was a loss of about 20 to 30 minutes of production time as well as raw material for approximately 40 to 50 rounds.
Available data
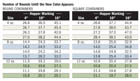
Kirk and his team collected data on the second production line at three different heights on the feed hopper, three different sizes of containers and two shapes. The data are summarized in the table "Number of Rounds Until the New Color Appears."
Questions
- What is the variation in the number of rounds until the new color appears for this production line?
- Which factors-feed hopper height, container size, container shape-have an effect on the number of rounds until the color appears?
- Set up a table for Kirk to use when introducing a new color at any of the three hopper heights for any of the three sizes and two shapes so that a minimum number of containers will be impacted.
- How many rounds will be involved in the transition?
Answers to March Brain Teaser
Bonnie is an engineer in charge of a group responsible for designing components for new automobiles and making changes in current component designs. Customer complaints focus on delays and design changes during the design process leading to delays and out-of-specification components at product launch. Bonnie's group is dedicated to discovering how to improve the design processes so her company can meet customer expectations.
Q: What is the behavior of each process with respect to elapsed time?
A: The concept design process is unpredictable for the past 35 requests. There are two points outside the upper limit on both the individuals chart and the moving range chart. See the individuals and moving range chart "Concept Design Process." The quote process is predictable at an average of 55.5 days with natural process limits from 40.1 to 71 days. The prototype process is unpredictable with points outside the limits and two long runs on the individuals chart and two points outside the upper limit on the moving range chart. Process behavior charts for the quote process and the prototype process can be found online at www.qualitymag.com.
Q: What can Bonnie predict for elapsed time for these processes if no changes are made?
A: Bonnie can only predict elapsed time for the quote process. She can predict that the quote process will take an average of 55.5 days with times for individual requests ranging from 41 to 71 days without any exceptional causes of variation as long as no changes are made to the process.
Q: What is the behavior of the number of design changes that occur during the prototype process?
A: The number of design changes is unpredictable with three individual values above the upper limit and two moving ranges above the upper limit. See the process behavior chart "Number of Design Changes."
Q: How can the analyses of these data from the past year help Bonnie and her team make improvements in the design processes to meet customer expectations?
A: First, Bonnie needs to focus her team's attention on the signals of exceptional variation on the charts for elapsed time for the concept design process and the prototype process. Also, they need to address the signals on the chart for number of design changes. Once the causes of the exceptions have been identified, they need to be eliminated from the process. For the quote process, Bonnie and her team need to determine what fundamental changes can be made in the process to reduce the average time. All of these process behavior charts can be used to focus improvement activities as well as monitor the results of process changes.
Links
Looking for a reprint of this article?
From high-res PDFs to custom plaques, order your copy today!


