Brain Teasers: Can Design Processes be Improved?
Situation
Bonnie is an engineer for a company that supplies components to an automotive customer. Her group is responsible for designing components for new automotive models and making changes in components for current models. At a recent meeting with the customer, they discussed delays experienced in the design process in previous years. Specific complaints were deadlines missed in submitting designs, excessive design changes resulting in additional time delays and products that did not meet specification at launch.

Available Data
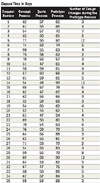
Data were available on total time for each process for each request from a customer as well as some details for the amount of rework involved in the prototype process. These data are summarized in the table "Data for Designing New Components."
Questions
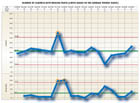
1. What is the behavior of each process with respect to elapsed time?
2. What can Bonnie predict for elapsed time for these processes if no changes are made?
3. What is the behavior of the number of design changes that occur during the prototype process?
4. How can the analyses of these data from the past year help Bonnie and her team make improvements in the design processes to meet customer expectations?

Answers to February Brain Teaser
Customer feedback is used to inform Brad's company if all requirements are met for an order for custom kitchen cabinets. After he became production manager, Brad discovered that every order had at least one error and that the major problem appeared to be incomplete orders. Brad realized that he needed to track and understand the shipping process along with specific information about incomplete orders. It appeared that missing parts led to the inability to build all cabinets in an order, which then led to incomplete orders.
Q: Is the number of cabinets with missing parts in assembly predictable?
A: No, the number of cabinets with missing parts is not predictable. There is one individual data value and two moving ranges outside the limits on the individuals and moving range (XmR) process behavior chart. The data value for January 25 appears to be a signal since it is much lower than the other values, but it is not outside the limits. See the chart: "Number of Cabinets with Missing Parts (Limits based on the average moving range)." One way to check to see if signals have been missed is to use the median moving range to calculate the limits. Moving ranges outside the limit can inflate the average moving range causing wider limits, but the median moving range is not as sensitive to extreme values. Using the median moving range shows that there are two individual values and four moving ranges outside the limits.
Q: For the specific missing parts, how might these data be summarized or analyzed?
A: One approach is to make separate XmR charts for each category of missing parts. With these charts Bart can determine if the types of missing parts are each predictable over time. See the charts for each specific part, for example "Number of Missing Hinges." Another way to summarize the specifics on missing parts is to construct a bar chart and check to see if the Pareto Principle applies. A quick look at the "Bar Chart of Missing Parts" (see online at www.qualitymag.com) indicates that the Pareto Principle is not present in these data.
Q: Based on the audit of orders in shipping, what can Brad expect from the current process?
A: An individuals and moving range of the missing units at audit shows a predictable process with an average of 2.9 cabinets missing per shipment. As many as 10 cabinets could be missing from a shipment because of routine variation. The average number of cabinets with quality issues is 1.2 per order with an upper limit of 4.8. See the charts "Number of Missing Cabinets" and "Number of Cabinets with Quality Issues," online at www.qualitymag.com.
Q: What actions should Brad and his team take next?
A: Since missing cabinets appears to be a result of missing parts together with a push to ship the order, Brad needs to work upstream in the process of making the cabinets as well as the process of kitting. One possible action is to hold the order until all parts are available. Another action could be directed at the kitting process.
Looking for a reprint of this article?
From high-res PDFs to custom plaques, order your copy today!


