Machine Vision in Color
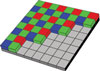
Shown here is a common Bayer color filter array (CFA) or mosaic pattern. Source: Matrox Imaging
Color is the manifestation of light from the visible part of the electromagnetic spectrum. It is perceived by an observer and is therefore subjective-two people may discern a different color from the same object in the same scene. This difference in interpretation also extends to camera systems with their lenses and image sensors.
A camera system’s response to color varies not only between different makes and models for its components but also between components of the same make and model. Scene illumination adds further uncertainty by altering a color’s appearance. These subtleties come about from the fact that light emanates with its own color spectrum. Each object in a scene absorbs and reflects (filters) this spectrum differently and the camera system responds to (accepts and rejects) the reflected spectrum in its own way. The challenge for color machine vision is to deliver consistent analysis throughout a system’s operation-and between systems performing the same task-while also imitating a human’s ability to discern and interpret colors.
The majority of today’s machine vision systems successfully restrict themselves to grayscale image analysis. In certain instances, however, it is unreliable or even impossible to just depend on intensity and/or geometric (shape) information. In these cases, the flexibility of color machine vision software is needed to:
Color images contain a greater amount of data to process-typically three times more-than grayscale images and require more intricate handling. Efficient and optimized algorithms are needed to analyze these images in a reasonable amount of time.
Color Analysis Tools
Currently there are software tools available to help identify parts, products and items using color, assess quality from color and isolate features using color. A color-matching tool determines the best matching color from a collection of samples for each region of interest within an image. A color sample can be specified either interactively from an image-with the ability to mask out undesired colors-or using numerical values.A color sample can be a single color or a distribution of colors (histogram). The color matching method and the interpretation of color differences can be manually adjusted to suit particular application requirements. The color matching tool also can match each image pixel to color samples to segment the image into appropriate elements for further analysis using other tools. The color distance tool reveals the extent of color differences within and between images, while the projection tool enhances color to grayscale image conversion for analysis-again using other tools.
The majority of color cameras feature a single sensor that employs a color filter array (CFA) or mosaic. This mosaic typically consists of red (R), green (G) and blue (B) optical filters overlaid in a specific pattern over the pixels.
A demosaicing operation-performed either by the camera or software-is needed to convert the raw sensor data into a proper color image, for example, with an RGB value for each pixel position. Several demosaicing techniques exist, each with a trade-off between speed and quality, such as an introduction of color artifacts. This demosaicing operation can and must be adjusted to normalize the (RGB) response of the setup, for example, camera system and illumination, and thus produce consistent color images.
The normalization factors are determined-most often automatically-by performing a white balance calibration: the machine vision system is presented a sample deemed white and the normalization factors to produce a white image are computed accordingly.
Controlled scene illumination also is critical for effective color machine vision-the light source, usually white and diffused, must provide a sufficiently consistent output and the scene must be adequately shrouded from the effects of varying ambient light.
The Right Color Space
Typically, color is represented mathematically by three components and is thus visualized as a point or region in three-dimensional (3-D) space. The most common color spaces for machine vision are RGB, hue, saturation and lightness (HSL) and Commission Internationale de l’Eclairage Lab (CIELAB).RGB is the most common color space since it is used natively by most cameras and by all computer monitors. In HSL, a given color is represented by its hue, saturation or purity, and luminance or brightness. The CIELAB color space was created to mimic human perception; the numerical difference between colors is proportional to typical human interpretation.
With HSL and CIELAB, it is easier to factor out the effect on luminance from nonuniform lighting, which adversely affects analysis. CIELAB is useful when the automated inspection needs to replicate human inspection criteria.
Extracting just the intensity or luminance information from a color image can result in objects or features, which differ only in color, becoming indistinguishable from one another. Principal component projection is a tool provided in certain software packages that uses the color distribution trend to optimize the conversion from color to grayscale and minimizes the loss of critical image information.
Color Distance
Color distance is how the difference between colors is measured. In its simplest form, the distance is computed between every pixel in an image and the corresponding pixel in a reference image or a specific color. The distance can be computed using various methods, for example, Euclidean, Manhattan and Mahalanobis/Delta-E. The color distance can be a simple and effective way of detecting defects best characterized by their color.Color Matching
A color matching tool performs one of two basic tasks: color identification or supervised color segmentation. Color identification compares the color in a given region to a set of predefined color samples to determine the best match if one exists.The region whose color needs to be identified is either known beforehand or located using another tool-like geometric pattern recognition. Supervised color segmentation consists of associating (and replacing) each pixel in an image or region with one of the predefined color samples and therefore separating objects or features by their color.
Supervised color segmentation also is used to obtain color statistics on an image; how much of one color sample vs. another. A color sample is defined either from a reference image or a specific color. If based on an image, the sample’s color is derived from statistical analysis (mean or distribution). A target area in an image is matched either by comparing its statistics (mean or distribution) with those of each sample or each pixel voting for the closest sample.
The mean-based method is quick but requires a carefully-defined target area. The vote-based method is slower, but the target area can be more loosely defined and it is more robust to outlying colors. The latter method also provides more detailed results and is used for supervised color segmentation. The histogram-based method is ideal for multicolored samples.
A score is computed to indicate how close the target color is to each sample color. Controls are provided to tailor the color matching for a particular application. A match is reported if the score is above thresholds for the best color sample (acceptance level) and the next best color sample (relevance level).
A situation can arise where the score is deemed acceptable for two or more color samples but too close between color samples for there to be a definite match. A color distance tolerance adjusts how close the target color needs to be to a sample color to be considered a match.
Optimized for Speed
Working in color means that there is more data to process and the data requires more elaborate manipulation. Color analysis tools must not only be accurate and robust to be effective, but they must also be optimized for speed. Color analysis tools take full advantage of the vector (SIMD) instruction units in contemporary CPUs, as well as their multicore designs.Color analysis tools offer the accuracy, robustness, flexibility and speed to tackle color applications with confidence. These color tools are complemented with a comprehensive set of field-proven grayscale analysis tools. V&S
Tech Tips
Looking for a reprint of this article?
From high-res PDFs to custom plaques, order your copy today!


