Selecting the Correct Analysis Method for Your Materials Sample
The basics of phase analysis, porosity analysis, and particle distribution.
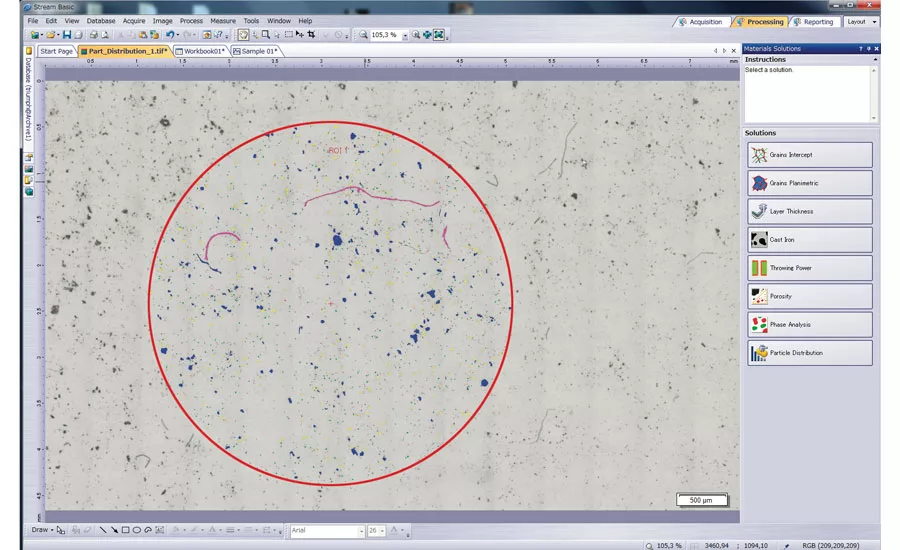
Figure 3: Particle Distribution: Particles extracted on membrane filter. Image created using Olympus Stream image analysis software. Source: Olympus

Figure 2: Porosity Analysis: Cross-section of carbide coating in thermal deposition processing. Image created using Olympus Stream image analysis software. Source: Olympus
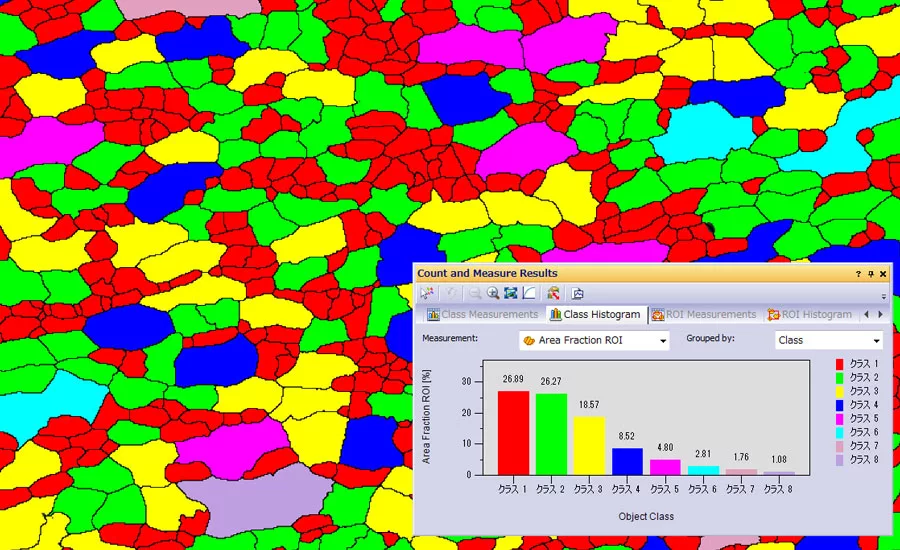
Figure 4: Separate Object Filter: Grain boundary detection with area percentage per classification. Image created using Olympus Stream image analysis software. Source: Olympus

Figure 1: Phase Analysis: Dual-phase polymer detection. Image created using Olympus Stream image analysis software. Source: Olympus
In industrial microscopy there are many way to quantify the materials in your sample. Today, we will look at three specific methods and discuss their similarities and differences. Phase analysis, porosity, and particle distribution all utilize light and color thresholding techniques to identify materials on your sample, but break out the data differently for your application.
Phase Analysis
Phase Analysis (Fig. 1) is one of the most basic ways of identifying and sorting multiple materials in a sample. When you are looking at a sample through a microscope and seeing each material as a unique color or gray value (a phase), imaging software has separated those materials through the process of defining thresholds for each specific material. Each material (phase) is presented as a percentage of the total image or of a region of interest so you will know quickly if proportions of materials in a sample are correct. Typical applications for this type of analysis include welding quality checks, die casting, steel microstructures, and composite materials.
Porosity Analysis
Porosity analysis (Fig. 2) starts similarly to phase analysis but provides data specific to measuring pores. In this case thresholding is used to identify the pores in a sample. Because pore size is often critical, filters are available to remove pores that are too small or too large. A porosity percentage along with pore density and maximum pore size are outputted, thus results can be based on the entire image or a region of interest. Typical applications for porosity analysis include voids in chemical materials and porosity in foam.
Particle Distribution
Particle distribution (Fig. 3) works similarly but in this case data can be distributed into different classifications based on size. Size is considered differently depending on application so options like area, Feret max, or equivalent circle diameter can be used to define size classifications. Classification distribution can also be considered differently depending on application, so options for particle count, particle percentage, or area-weighted particle percentage can be selected. Typical applications for particle distribution include stability in suspension (e.g., sediments, paints), efficiency of delivery (e.g., asthma inhalers), texture and feel (e.g., food ingredients), and appearance (e.g., powder coatings and inks).
Other Analysis Methods
If none of these methods meets your specific requirements, a comprehensive object detection and classification solution should fit your needs. Count and Measure utilizes threshold detection to identify materials in a sample. Classification and Distribution can be performed by more than 50 different options including shape, size, position, and pixel properties. Filters can be used in conjunction with each classification to refine the resulting data (Fig. 4). All data can be output to workbooks and reports for clear presentation of your results.
Looking for a reprint of this article?
From high-res PDFs to custom plaques, order your copy today!


")


