Gage R&R: The Key to Reducing Measurement Variation
A critical part of the journey toward reducing variation is developing confidence in the system used to measure the process.
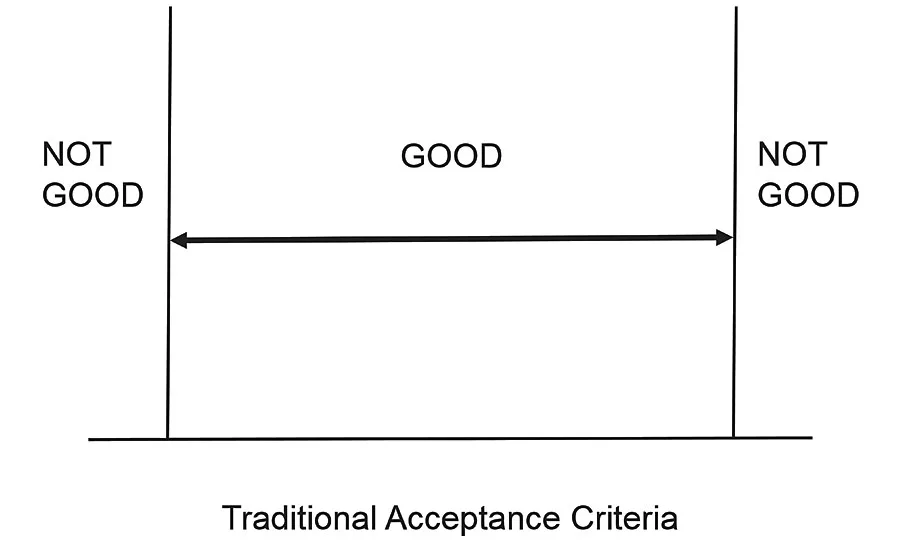
Figure 1a
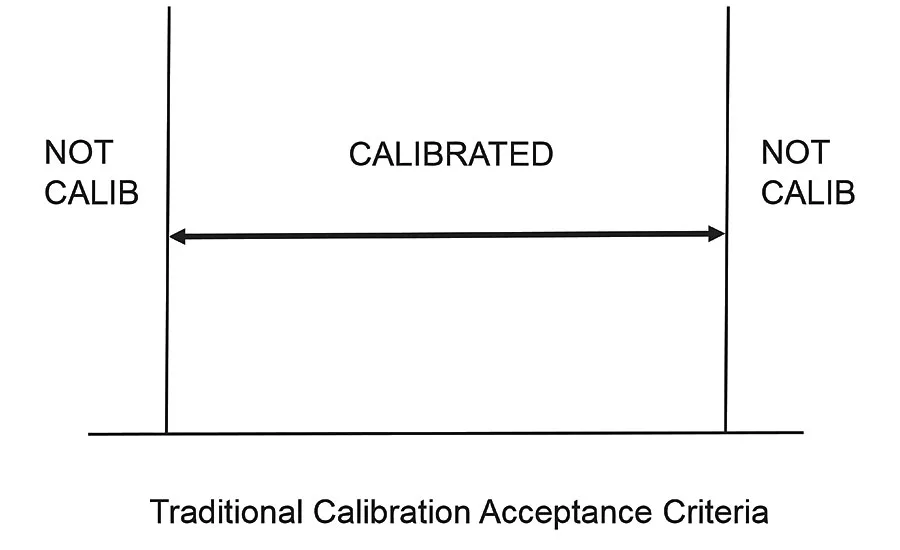
Figure 1b
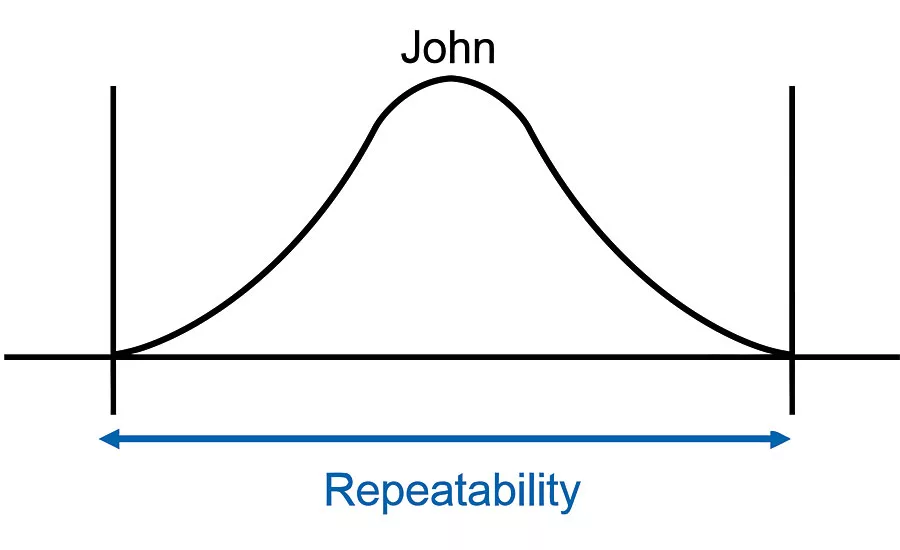
Figure 2: The repeatability is represented as the width of the histogram.
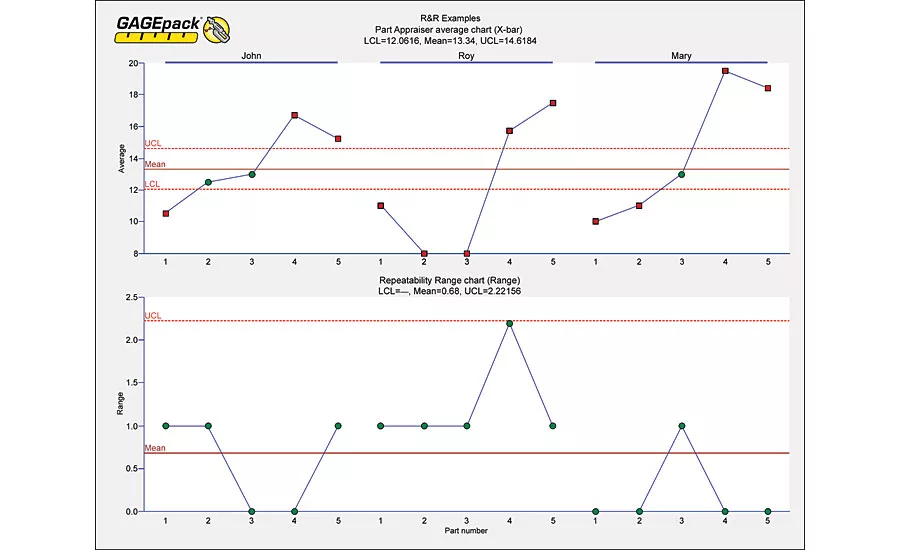
Figure 3: This shows an X-bar and Range chart for a study where three operators (John, Roy, and Mary) took two readings on five different parts with the same instrument.
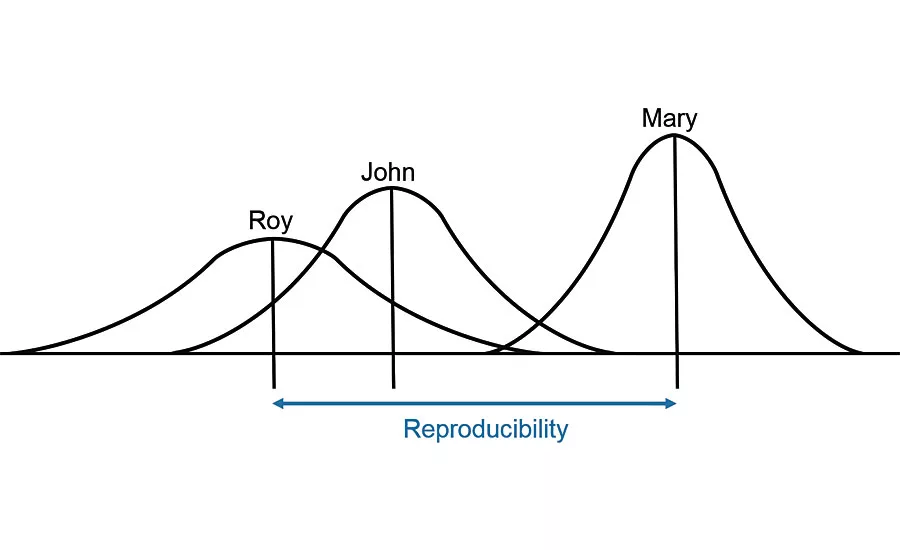
Figure 4: An easier way to visualize Roy’s noticeable variation between measurements is with these distribution curves.
It’s difficult to think of a manufacturing environment in which measurements of processes aren’t taken in one form or another. These measurements, usually compared to some standards, are taken to see how processes are behaving to ensure that the customer is getting what he or she expects.
In any setting, business or personal, the trust we place in the measurement instruments can have a significant effect. Whether it’s the ice cream manufacturer’s scale that weighs your pint, a blood pressure monitor that checks your spouse’s hypertension, or the gas gage in your car, we typically trust these measurements at face value, questioning the reliability only when something goes wrong.
But it is necessary to establish confidence in the accuracy and reliability of the measurement system. Consider, for example, measurements that are taken in an engine plant from two separate departments: processing (at the machine) and final inspection. If the results differ, the final inspection result often becomes the “real” measurement. Rarely does the question get asked, “Why do the measurements differ?” However, accepting the final measurement as the correct measurement can become a reckless practice.
The traditional approach to the acceptance of a measurement has been on a go/no-go, good/not good basis (Figure 1a). If the measurement is within specification limits, it passes. If not, it fails. The traditional viewpoint on whether an instrument is correctly calibrated or not is based on the same go/no-go criteria. As long as the instrument is within the standard range, it is considered calibrated. (Figure 1b).
A critical, yet often overlooked, part of the journey toward reducing variation and continuously improving is developing confidence in the system that is used to measure the process. Most of the improvement efforts in organizations are spent on reducing variation among products. Little if any attention is paid to the variation introduced into the overall picture by the measurement system itself.
While other sources of measurement variation exist, the two primary sources are equipment variation (repeatability) and appraiser variation (reproducibility). If we reduce repeatability and reproducibility (R&R) variation to the lowest amount possible, we can have more confidence in detecting variation in the actual product we’re producing.
Repeatability is the variation seen in multiple measurements by one piece of equipment, by one operator, of the same part or sample, of the same characteristic. It is associated with equipment variation (EV).¹ In the example of Figure 2, John took multiple measurements of the same part. We can visualize the amount of variation with a simple histogram. The repeatability is represented as the width of the histogram.
Another way to visualize the measurements is with the use of an X-bar and Range chart. The X-bar chart shows the instrument’s power of discrimination, or the ability of the instrument to tell one piece from another. In this type of study, we want as many points out of control as possible. The X-bar will show the average values of the measurements for many parts in a study. The Range chart shows the error of measurement, since the R values are the differences between successive measurements of the same product. An unstable R-chart is an indication that the instrument operator may be having trouble taking consistent measurements. In general, the average range should be as small as possible, with few or no indications of instability.
One manufacturing site experienced an unusual number of out-of-control points on the Range chart for one of their gage R&R studies. This led management to believe the operators were struggling to get consistent measurement replications. After some root cause analysis, a quality technician discovered that the gage hadn’t been calibrated for several months before the R&R study, and the device was out of tolerance. After the gage was calibrated, the study was repeated and the special cause variation in the Range chart was eliminated.
A focus on reproducibility compares operator variation. The reproducibility is the variation between the averages of different operators, when using the same equipment, same sample or part, and the same characteristic. It indicates the operator variation in the measurement system and is commonly referred to as appraiser variation (AV).² In the previous example, the measurement error consisted of the error of the equipment and one operator. Figure 3 shows an X-bar and Range chart for a study where three operators (John, Roy, and Mary) took two readings on five different parts with the same instrument.
The X-bar chart shows that all three appraisers have fairly decent agreement, but Roy’s measurements of part two and three are significantly different from the other two operators’ measurements. In addition, the Range chart highlights the variation for operator Roy, which is greater than operators John and Mary.
An easier way to visualize Roy’s noticeable variation between measurements is with the Figure 4 distribution curves. We hope to see a tall and narrow histogram, which demonstrates consistent measurements from one replication to another. Mary’s measurements are the most consistent of the three operators, where Roy’s distribution is wide and flat. Upon further investigation, the company discovered that Roy was a new hire who had not received proper training on the measurement procedure. After he successfully completed the training program, the study was repeated, and his measurements were much more consistent, resulting in a dramatic improvement in the measurement system as a whole.
Evaluation of the measurement system should be an important element of any continuous improvement activity. The evaluation builds trust in the instruments, operators, and processes. An understanding of measurement system variation will help provide a full understanding of your process so that you can better predict its future performance and ultimately deliver a more consistent product to the customer.³ Then you can be certain that the pint of ice cream you just devoured was actually, well, a pint.
References
Measurement Systems Analysis, Automotive Industry Action Group, 4th Edition, 2010, p. 54.
Measurement Systems Analysis, Automotive Industry Action Group, 4th Edition, 2010, p.55.
Snee, Ronald D., Ph.D. “Process Variation—Enemy and Opportunity,” http://asq.org/quality-progress/2006/12/statistics-roundtable/process-variation--enemy-and-opportunity.html, accessed July 20, 2016.
Looking for a reprint of this article?
From high-res PDFs to custom plaques, order your copy today!


