Repetitive Shock or Electro-Dynamic: Which Vibration System Will Meet Your Needs?
ED and RS systems generate vibration through very different mechanisms, resulting in different fatigue characteristics.
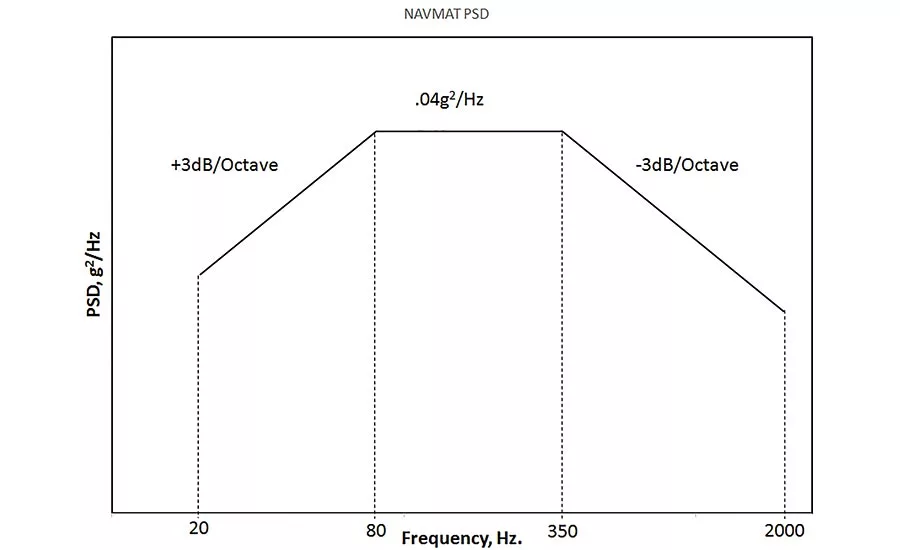
Figure 1- NAVMAT Profile
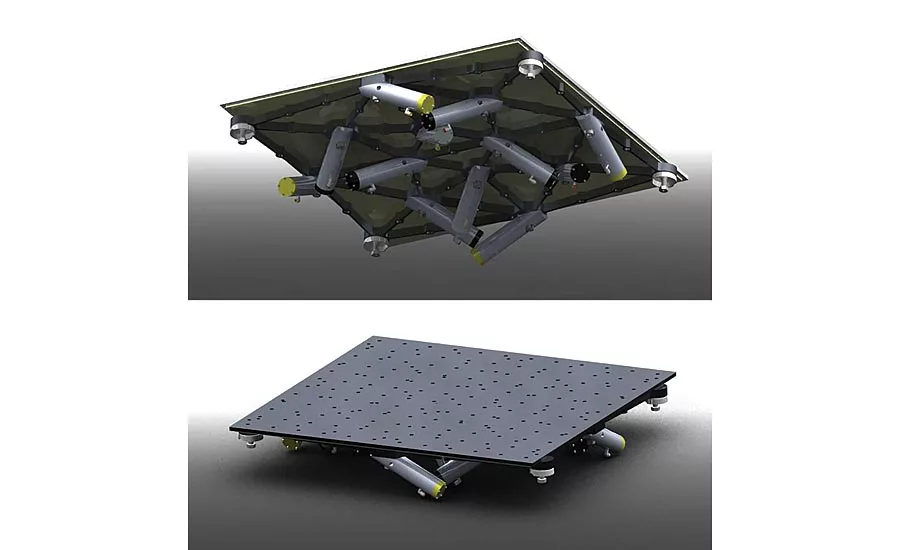
Figure 2: Illustration of an RS table
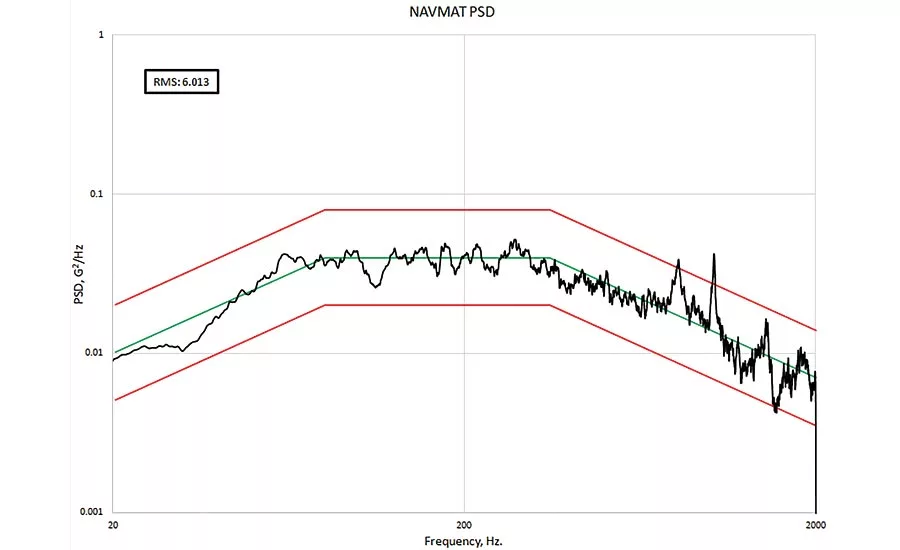
Figure 3: NAVMAT PSD
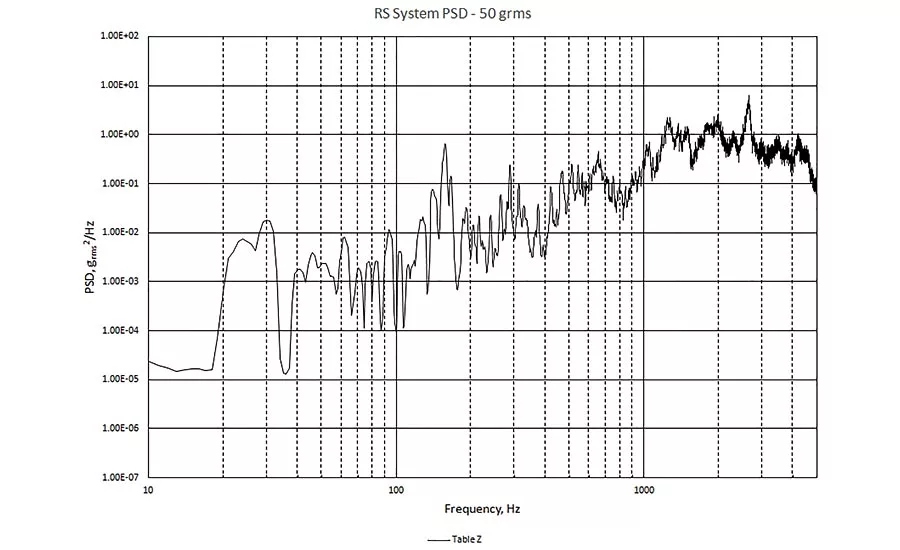
Figure 4: RS Table PSD
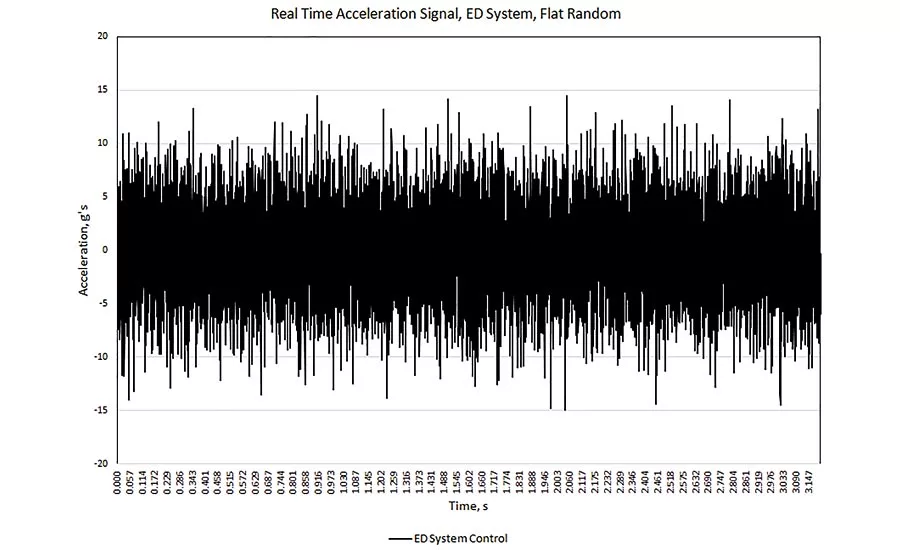
Figure 5: Real Time Acceleration Signal for an ED Shaker During Random Vibration (Fox Lang & Van Buren, 2007)
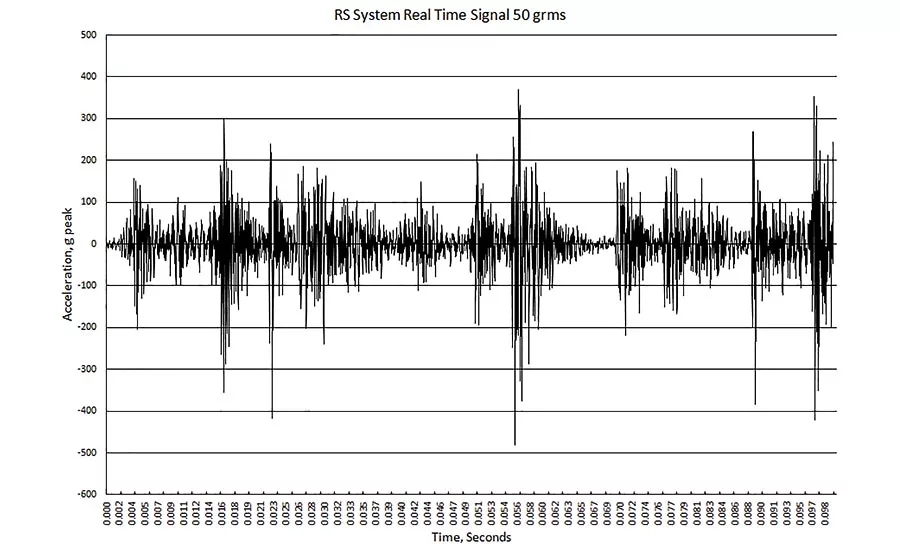
Figure 6: Real Time Acceleration Signal for an RS Shaker During Random Vibration, Setpoint = 50 grms
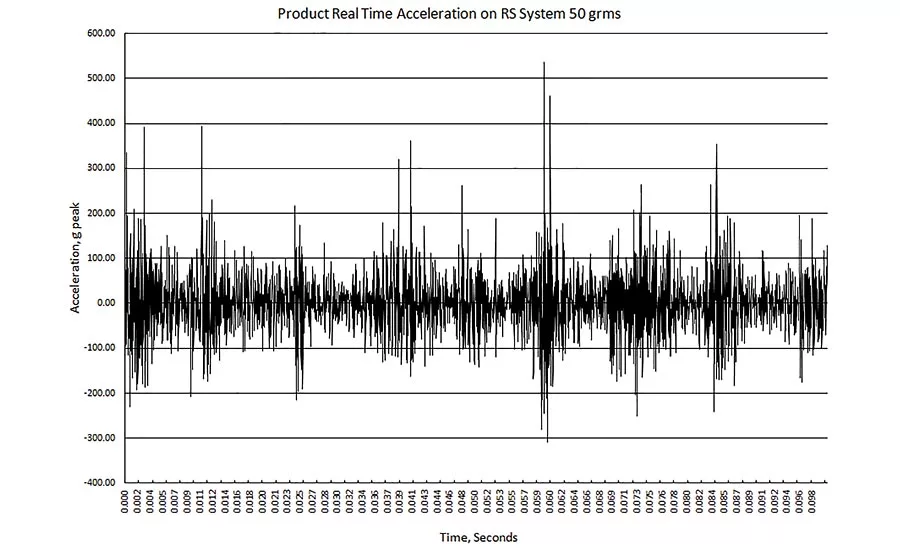
Figure 7: Real Time Signal on a Product
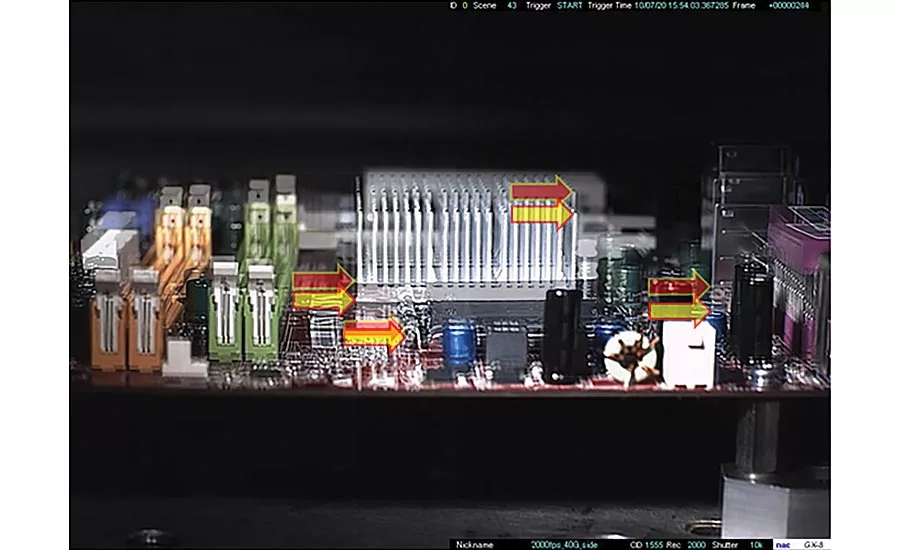
Figure 8: Board Displacement during RS Stressing
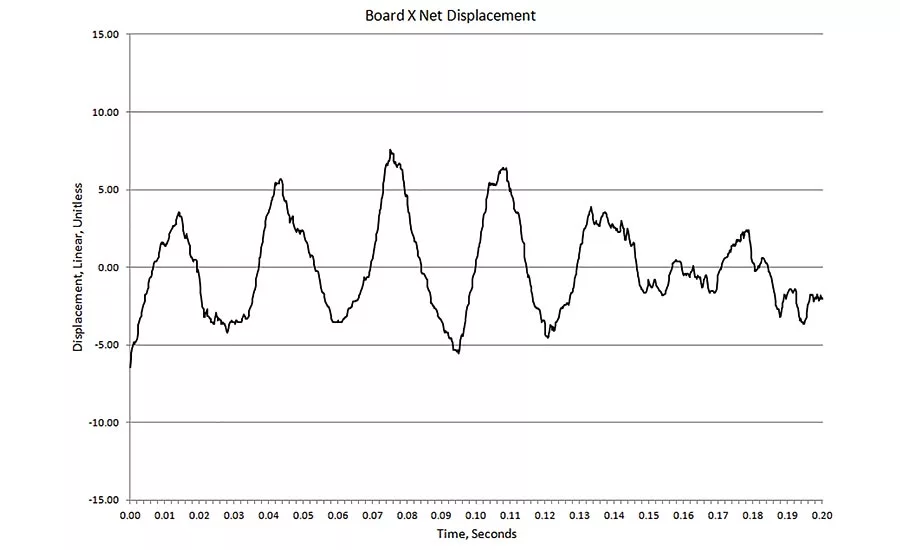
Figure 9: Board Displacement, X Axis
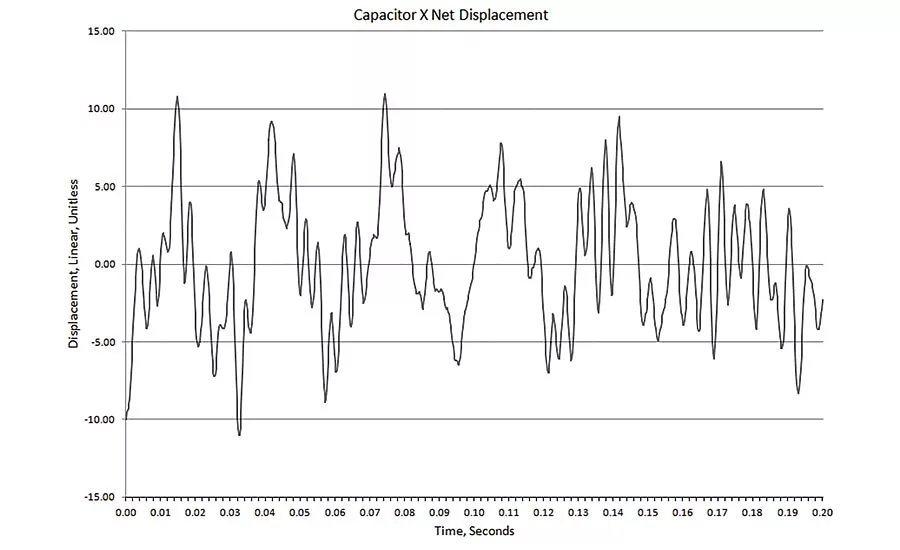
Figure 10: Large Capacitor X Displacement
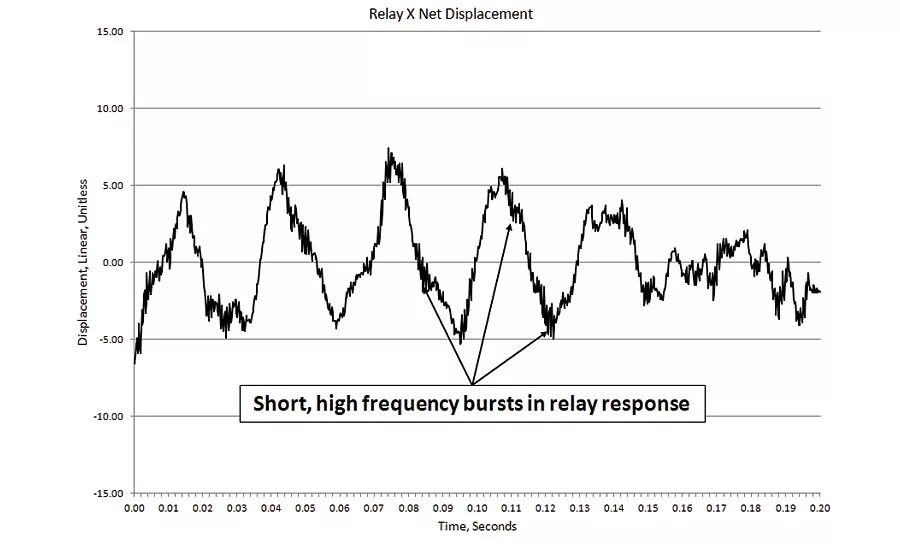
Figure 11: Small Relay X Displacement
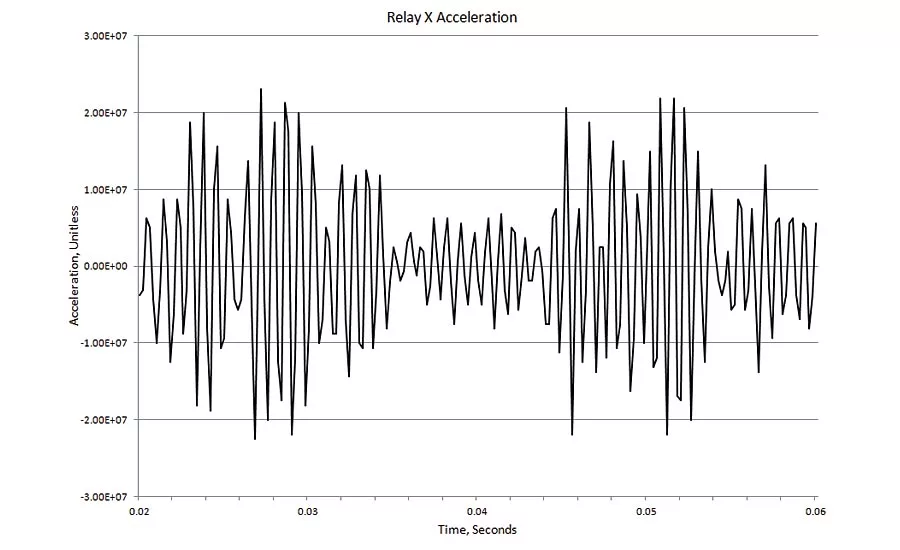
Figure 12: Relay Acceleration, X axis

Figure 13: Board PSD, Y Axis
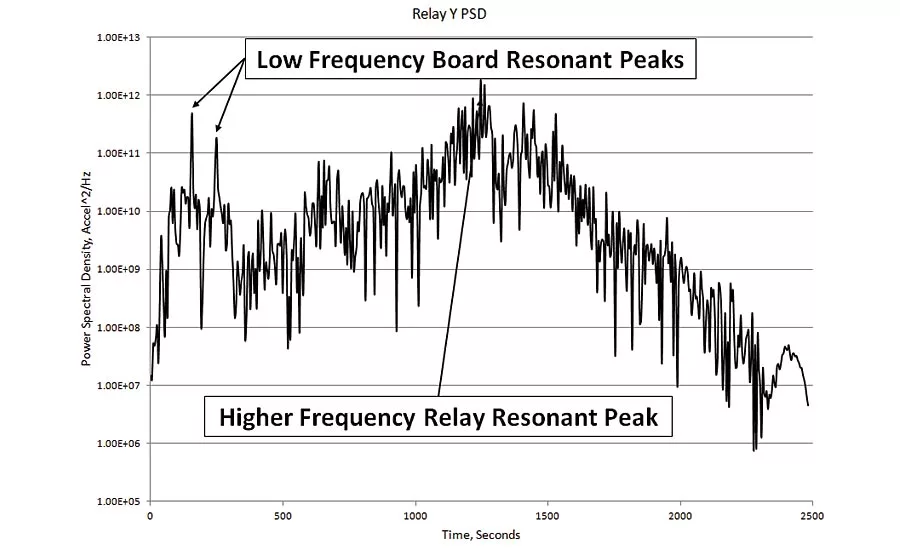
Figure 14: Relay PSD, Y Axis
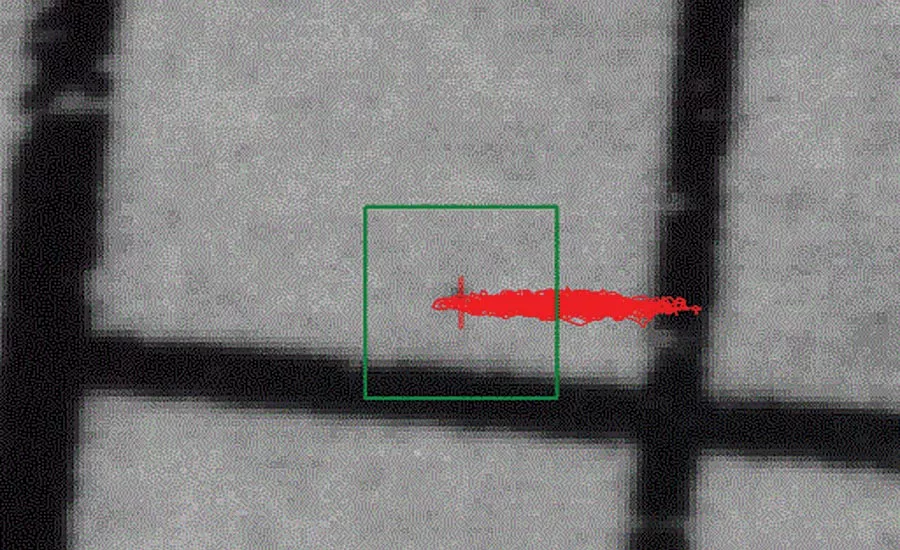
Figure 15: Motion Tracking Results, ED Shaker
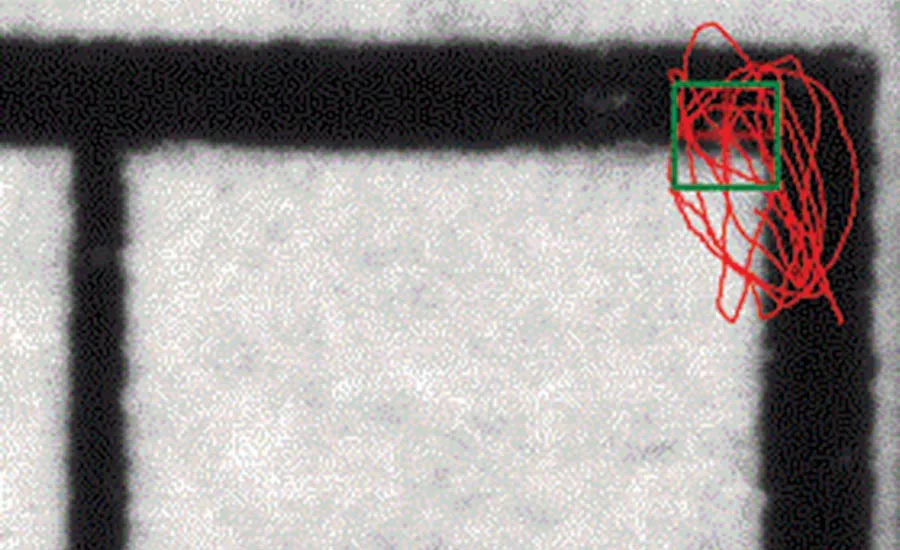
Figure 16: Motion Tracking Results, RS System
The classic ElectroDynamic (ED) vibration system has been used for many years to accelerate vibration fatigue in Accelerated Life Testing (ALT). During the Mercury, Gemini and Apollo programs, ED shakers performing random vibration were utilized, with significant success (United States Navy, 1979). Shaped random Power Spectral Density excitation (PSDs) were specified to meet specific stress goals, and they could be generated and controlled very precisely (U.S. Department of Defense, 1996). The ‘NAVMAT’ profile, shown in Figure 1, became a de facto standard for vibration screening (Ciufo, 2005).
ED shakers are familiar to virtually any engineer or technician whose work includes evaluating the ability of a product to tolerate end-use environment mechanical stresses, shipping stresses or environmental stress screening (ESS) that includes vibration stresses. The basic design and operation of ED shakers is most easily understood through the quite accurate analogy of an audio speaker and amplifier system, except on a much larger scale (Lang, 1997).
RS systems were developed more recently. Unlike ED systems, which deliver vibration with a precisely controlled spectral content along a single axis, repetitive shock systems deliver “Six Degree of Freedom” vibration, meaning the unit under test (UUT) is simultaneously stimulated in three axes as well as the rotations around these axes (General Motors, 2011). The generated spectral profile is referred to as ‘pseudo-random.’ Unlike the NAVMAT profile implementation, the RS system’s spectral content is not controlled in real time, but is a characteristic of the table, fixture and product response to the impacts from the actuators beneath the table. The final vibration excitation experienced by the UUT is a combination of the responses from the fixture and table, as well as its own response to the shock inputs from the actuators. In fact, the repetitive shock system really should not be considered a vibration table. It is a repetitive shock machine.
The RS system was designed to meet a very specific purpose—to rapidly fatigue the UUT and force the weakest mechanical parts of the design to fail, allowing increased reliability and customer satisfaction (Qualmark Corporation, 2010).
Given the significant differences in the purpose of the repetitive shock system, it must be radically different from an ED system. An intuitive understanding of the table behavior can be achieved by imagining a semi-rigid table with small jackhammers continuously beating on the bottom of it. Figure 2 shows the construction of a typical RS system. The actuators are mounted at an angle to the table surface, so each impact delivers a shock in more than one axis. They are also oriented to deliver shocks in different directions on the table. The UUT is secured to the top of the vibration table by special fixturing that is very different from the fixturing used on an ED machine.
Comparison of PSDs
The random vibration generated by both of these systems is often characterized in terms of grms and the shape of the power spectral density (PSD) graph. Conclusions about the comparative effectiveness of random vibration from the two systems, particularly for inducing fatigue in a product and precipitating failures in an environmental stress screen (ESS) are often based on comparisons of these metrics. However, the vastly different design of the two systems affects this induced stress, which can lead to erroneous conclusions concerning the value of one system over another. By understanding the differences between the systems, and understanding the different tasks they were designed to do, a user can make the most effective use possible of both systems, enabling them to meet the true ultimate goal of the use of the systems—to produce the most reliable product possible, reduce warranty costs, increase product uptime and increase customer satisfaction.
As stated above, the PSD of an ED system can be carefully controlled and shaped. The measured PSD on an ED system that is programmed to the NAVMAT profile is shown in Figure 3. The upper frequency limit of a larger ED system is typically near 2000 Hz, which limits its ability to excite the resonant frequencies of small electronic components (Henderson G. , 2009). In contrast, consider the PSD from the table top of a repetitive shock system (Figure 4). The shape of the PSD is not flat, as you would expect for a random signal. Also, there is significant energy above 2000 Hz in the system, increasing its effectiveness for fatiguing smaller assemblies and components with higher resonant characteristics, such as the SMT devices that are typical in technology today.
Comparison of Real Time Signals
This difference in excitation is made clear when the real time acceleration signals from both systems are examined. Figure 5 shows the acceleration signal from an ED system during random vibration. A key feature to note is the fact that the peak acceleration levels stay within a 3sigma bandwidth. This is a typical characteristic of random vibration when generated by an ED controller (Fox Lang & Van Buren, 2007). In addition, the shaker has a limit on the maximum acceleration peak it can deliver without damage to itself, and the controller will intelligently limit the drive to the shaker to make sure this does not happen.
The real time signal from an RS system is shown in Figure 6. The first thing that is obviously different is the instantaneous acceleration levels. A sharp acceleration spike indicates when an actuator strikes the table, with the subsequent ringing and drop in amplitude being characteristic of the response of the table. The overlapping actuator strikes can be clearly seen. The measurement shown here is in the Z axis, perpendicular to the table top. Similar types of signals are seen in the X and Y axes as well (Henderson G. , 2009). In the repetitive shock system, the maximum instantaneous acceleration is much higher than in the ED system. The maximum level seen in this example is approximately 400 g’s, much higher than that achieved by the ED systems.
Additional Effects of Shock Excitation
A more in-depth evaluation of the actual product response in the two systems reveals another key difference. With an ED system, the PSD gives a clear definition of the vibration input into the UUT. With an RS system, the PSD, measured at the table top, is only a part of the input. The shock that is delivered to the table is carried by the fixturing into the product itself. Figure 7 shows the time signals recorded on a product under test on a repetitive shock system. The spikes associated with the hammer strikes are clearly seen in these time signals. These spikes constitute a mechanical shock into the product, and the product will respond at its own resonant frequencies. It is quite possible that these frequencies will not be present in the PSD measured on the table top. Since fatigue occurs primarily at the resonant frequency of a device or component (Henderson & Piersol, 1995) this means that the shocks from the RS system will rapidly induce fatigue in a product regardless of the presence or level of those resonant frequencies at the table top.
High Speed Video Brings RS into Focus
The complex and random product motion that results from repetitive shock excitation can make it difficult to intuitively understand the effects of the shocks on a product. This understanding can be greatly enhanced by analyzing high speed (5,000 fps) video of PCA and component motion on an RS system. (See the referenced video at https://www.youtube.com/watch?v=I4Jcf3YbaoA.)
When the motion of the PCA in a high speed video is compared to the driving excitation of the table top and fixturing, it is clear that the displacement of the table and fixture are very low, but the board’s response is higher. As the board flexes, strain is induced at the attachment points for all components. Extremes of the PCA’s motion are shown in Figure 8, which shows two, overlaid frames from the high speed video with key PCA locations indicated for comparison.
Motion analysis of the video allows the displacement of chosen targets to be tracked. The velocity and acceleration of those points can then be calculated. This analysis describes tracking results from three different points on the PCB being tested. These were the board itself, the top of a large electrolytic capacitor, and the front of a smaller sugar cube relay. The analysis allowed tracking in two axes simultaneously.
Figure 9 shows a graph of the resulting displacement data from the board itself. The shocks have induced large, slow excursions in the circuit card, even though those low frequencies were not present in the table top motion.
Figure 10 is a graph of the displacement of the large capacitor. The large excursions of the board are clear, but superimposed on these excursions is the resonant response of the capacitor.
Figure 11 shows the displacement of the small relay. As with the large capacitor, the relay is moving with the board, and so shows the board’s displacement. However, the displacement of the relay includes short, high frequency bursts of motion at frequent intervals. Figure 12 shows the relay acceleration, calculated from the displacement data. It is clear from the waveform that the relay is responding to the shocks from the actuators with a sharp acceleration followed by a ring down. Because the relay is resonating at a higher frequency (~1300 Hz based on the acceleration graph), it has time to ring down between actuator strikes.
PSD graphs were created from the Y axis acceleration of the board and the relay. These are shown in Figure 13 and Figure 14. With this data in hand, the frequency domain characteristics of the board and relay can be examined.
The two low frequency peaks in the board PSD are likely due to the observed resonant response of the board in the displacement data. As expected, these two peaks are duplicated in the relay PSD, since the relay was moving with the board. However, the relay PSD clearly differs from the board PSD in the higher frequencies, showing a peak at 1300 Hz, coinciding with the real time acceleration data from the relay.
Another interesting observation can be made from the high speed camera video by looking at the differences in the component motion between ED and RS excitation. Figure 15 shows the tracking lines that resulted from tracking a point on an accelerometer mounted on a product on ED system. As expected, the point moved in a single axis. Tracking results of the same component on a Repetitive Shock system are shown in Figure 16. Although this analysis only shows two axes, similar differences are seen in the third axis. Clearly, the RS system is providing multiple axis excitation (Neill Doertenbach, 2015).
Different Excitations, Different Goals
These differences do not in any way invalidate the effectiveness of either of these systems. They simply emphasize the fact that the systems are designed to meet different goals in the overall tasks of reliability engineering. In general, ED systems excel at compliance and specification testing, while RS systems are ideal for failure oriented testing.
Summary
ED and RS systems generate vibration through very different mechanisms, resulting in different fatigue characteristics. Attempts to evaluate these differences by simply looking at the PSDs generated by the systems will almost certainly result in poor conclusions. By understanding the differences in the systems and the different goals that they were designed to meet, they can both be used very effectively in a reliability program.
References
Ciufo, C. (2005). Despite Questions of Validity, HALT & HASS Remain Prevalent”. COTS Journal(February).
Fox Lang, G., & Van Buren, J. (2007). How Well Does 3 Approximate Infinity? Vibration Research Corporation.
General Motors. (2011). Worldwide Engineering Standards, GMW8287, Highly Accelerated Life Testing. General Motors Corporation.
Henderson, G. (2009). Comparing NAVMAT Versus 6DOF For HALT/HASS Testing. COTS Journal(June).
Henderson, G. R., & Piersol, A. G. (1995). Fatigue Damage Related Descriptor for
Random Vibration Test Environments. Sound and Vibration.
Lang, G. F. (1997). Electrodynamic Shaker Fundamentals. Sound and Vibration.
Neill Doertenbach. (2015). Senior Applications Engineer, Qualmark Corporation. Unpublished Research Results. Denver.
Qualmark Corporation. (2010). Qualmark
HALT Testing Guidelines. Denver, Colorado: Qualmark Corporation.
U.S. Department of Defense. (1996). MIL-HDBK-781A: Handbook For Reliability Test Methods, Plans and Environments for Engineering, Development Qualificiation and Production. U.S. Department of Defense.
United States Navy. (1979). NAVMAT P-9492: Navy Manufacturing Screening Program.
Looking for a reprint of this article?
From high-res PDFs to custom plaques, order your copy today!


