Is Your Measurement System Adequate?
If you can’t trust your measurement system, then you can’t trust the data it produces.
We can use the Gage R&R results to assess the measurement system.
The Gage Run Chart is another tool that can be used to identify measurement system issues.
Have you ever stepped on a scale to weigh yourself, stepped off the scale, and then stepped back on to measure your weight a second time? Have you ever gotten two different readings? Whether you are monitoring your weight or trying to improve a process vital to your company’s success, it is imperative that the measurement system you use is adequate.
While no measurement system is perfect, we rely on such systems to quantify data that help us control quality and monitor changes in critical processes. So, how do you know whether the changes you see are valid and not just the product of a faulty measurement system? After all, if you can’t trust your measurement system, then you can’t trust the data it produces.
Most measurement systems contain some variation, and we can use a Gage Repeatability and Reproducibility Study (Gage R&R) to quantify that variation and assess a measurement system.
What Can Gage R&R Do for Me?
Performing a Gage R&R study can help you to identify problems with your measurement system, enabling you to trust your data and to make data-driven decisions for process improvement.
Measurement system variation can be split into two components: repeatability and reproducibility.
Repeatability is the variation observed when the same operator measures the same part multiple times with the same device, while reproducibility is the variation observed when different operators measure the same part with the same device. In a Gage R&R Study, the measurement system variation is compared to the part-to-part variation, which will be the largest component of variation if the measurement system is sufficient.
In practical terms, this means that Gage R&R studies can tell you if inconsistencies in your measurements are too large to ignore—and help you figure out whether the inconsistency could be due to a faulty tool or inconsistent operation of a tool.
Reveal an inconsistent tool
Let’s look at an example to better understand how Gage R&R studies work.
Suppose a company wants to use a control chart to monitor the fill weights of cereal boxes. Before doing so, they conduct a Gage R&R study to determine if the system which measures the weight of each cereal box is producing precise measurements.
The best way to ensure that measurements are valid is to look at repeatability, or the variation of the measurements taken by the same operator for the same part. If we weigh the same cereal box under the same conditions a number of times, will we observe the same weight every time? Weighing the same box over and over again can show us how much variation exists in our measurement system.
For this experiment, we can look at repeatability based on two different operators’ measurements. If the Gage R&R results show that even when the same person weighs the same box on the same scale, the measurements vary by several grams, then the scale is most likely in serious need of recalibration. The faulty scale would have rendered a control chart for these measurements virtually useless.
Highlight operator differences
But the variation that exists in the measurement system is just one aspect of a Gage R&R study. We must also look at reproducibility, or the variation due to different operators using the measurement system. A Gage R&R study can tell us whether a measurement differs from one operator to the next and by how much.
Suppose the same company who wishes to monitor fill weights of cereal boxes hires new employees to help record measurements. The company uses a Gage R&R to evaluate both the new and experienced operators.
The study reveals that when employees weigh the same cereal box, the measurements of new hires are too high or too low more often than the measurements of experienced employees. This finding might indicate that the company should conduct more training for the new hires.
Follow These Steps to Conduct a Gage R&R Study:
- Take a random, representative sample of parts to measure.
- Randomly select qualified operators to take the measurements. You need at least two operators to estimate reproducibility.
- Decide how many measurements each operator should take.
- Create the measurement plan and take the measurements.
- Run the analysis.
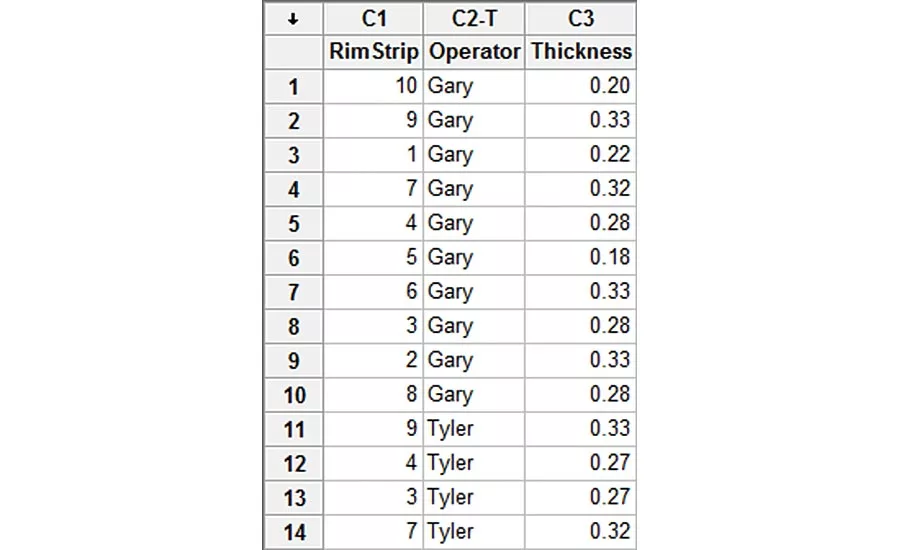
In the following example, three operators have measured the thickness of ten bicycle tire rim strips two times each. Note that each operator measured the parts in random order to minimize external factors.
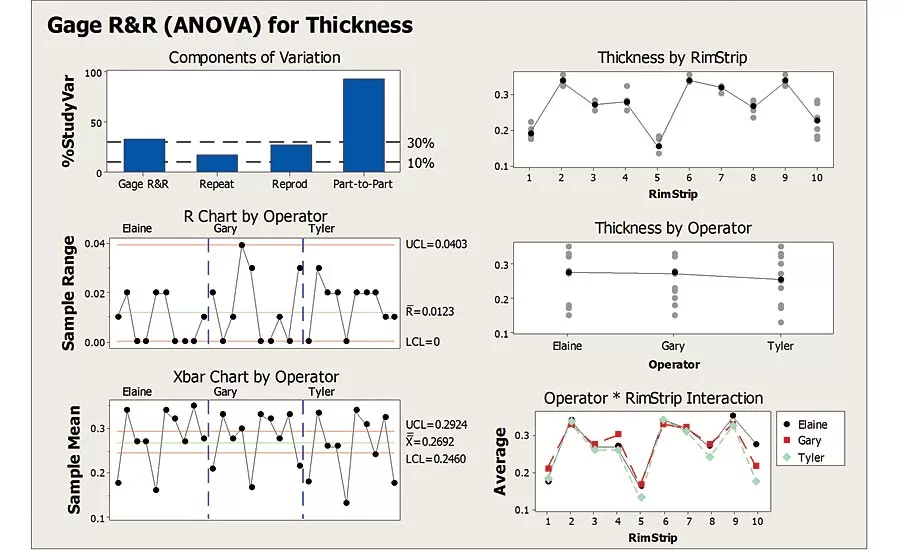
We can use the Gage R&R results to assess the measurement system. The Components of Variation graph shows the amount of variation contributed by the Gage R&R combined, repeatability, reproducibility, and the part-to-part. Typically, a Gage R&R %Study Variation less than 30% is acceptable, while less than 10% is ideal.
In this analysis, the %StudyVar for Gage R&R is greater than 30%, with reproducibility being the largest contributor. Therefore, the measurement system needs improvement and the system may not be able to distinguish between parts.
We can use the other graphs to figure out why the Gage R&R %StudyVar is larger than desired. For example, the Thickness by RimStrip and Operator*RimStrip Interaction plots show a greater amount of variation between the operators’ measurements for the tenth rim strip, which contributes to the poor reproducibility results. However, the R Chart, which can be used to identify repeatability issues, is in control. In addition, the Xbar Chart is out of control, which is also favorable. This indicates that there is more variation between the parts than when the same operator measured the same part repeatedly.
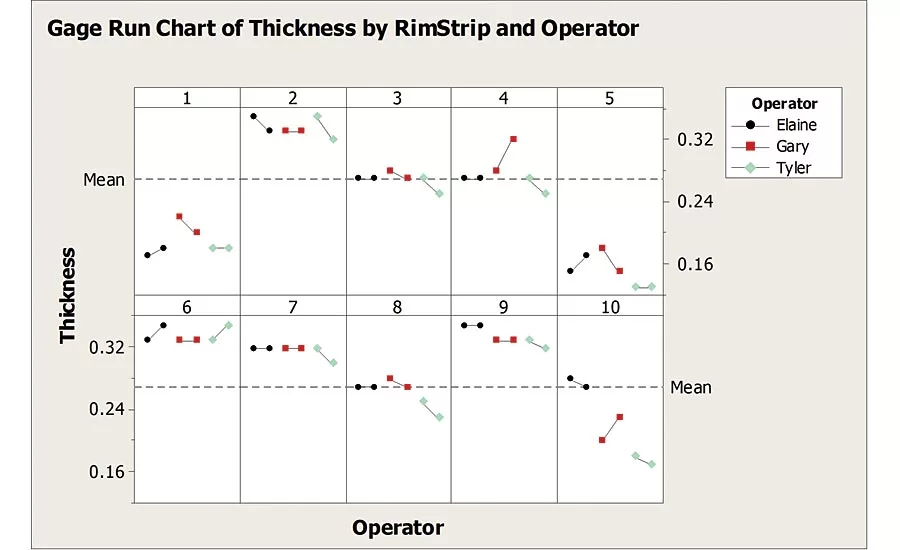
The Gage Run Chart is another tool that can be used to identify measurement system issues.
This chart again shows that part 10 was particularly difficult to measure. The Gage Run Chart will also reveal patterns in the data. In this analysis, we can see that Tyler almost always measures the rim strips smaller the second time, which would have gone undetected if we relied solely on the Gage R&R results.
The Gage R&R Study shows that the measurement system used to measure rim strip thickness needs improvement. Perhaps there were certain attributes of part 10 that made it difficult to measure, and the Gage Run Chart indicates that Tyler may have used a different procedure when measuring the rim strips a second time. There are many causes for inadequate measurement systems, including issues with the measurement device itself, an operator who was not properly trained, or a measurement tool that exhibits wear out after repeated use. Whatever the case may be, evaluating your measurement system is crucial; only then can you uncover measurement system issues and build confidence in your data.
Looking for a reprint of this article?
From high-res PDFs to custom plaques, order your copy today!


