How to Determine the Appropriate Mobile or Handheld Metal Analyzer for On-the-Spot Metal Testing Tasks
Quality-conscious organizations can’t afford to hand off responsibility for metals verification.
Mobile and handheld metal analyzers offer low costs and accuracy for a wide range of material testing tasks.
For metal producers, processors, recyclers, contractors and others, continuous quality control plays a key role in establishing the identity and composition of various metals and alloys from initial melt to finished product or end use. Metals and alloys need to be accurately sorted, identified, and verified at each stage of the process to make certain they meet specific customer and/or industry requirements for physical and chemical composition.
For businesses that perform metal production, processing, recycling, or service contracting, an alloy mix-up at the shipping dock or on the factory floor risks an expensive, inconvenient batch rework or the possibility of a catastrophic loss of business. Fortunately, metal inspection has been made easy, accurate and affordable with the availability of portable, mobile optical emission spectroscopic (OES) metal analyzers and handheld X-ray fluorescence spectrometers.
When it comes to metals specifications, the news is full of reports of mistakes, mismeasurements and other related scandals by a host of industries. It’s increasingly clear that quality-conscious organizations can’t afford to hand off responsibility for metals verification. The inspection of the metal makeup of incoming and outgoing components is a critical quality control (QC) task for companies worldwide.
While the focus of this article is on steels, non-ferrous alloy users are confronted with similar situations and are required to perform similar testing tasks. Some steel products are easy to analyze. For many suppliers and end users, testing with a handheld X-ray fluorescence (XRF) or simple handheld optical emission spectrometry (OES) analyzer is adequate. Their size and relatively low initial costs have created great interest in these handheld analyzers, which produce fast results for on-the-spot alloy identification, grade sorting or verification.
In many cases, the presence or absence of an alloying element in a steel component is critical to its performance but impossible to detect by physically inspecting the item. Positive material identification (PMI) has become accepted practice for the process and equipment supply industries. The industry-standard approach for achieving efficient PMI is via elemental analysis of the materials.
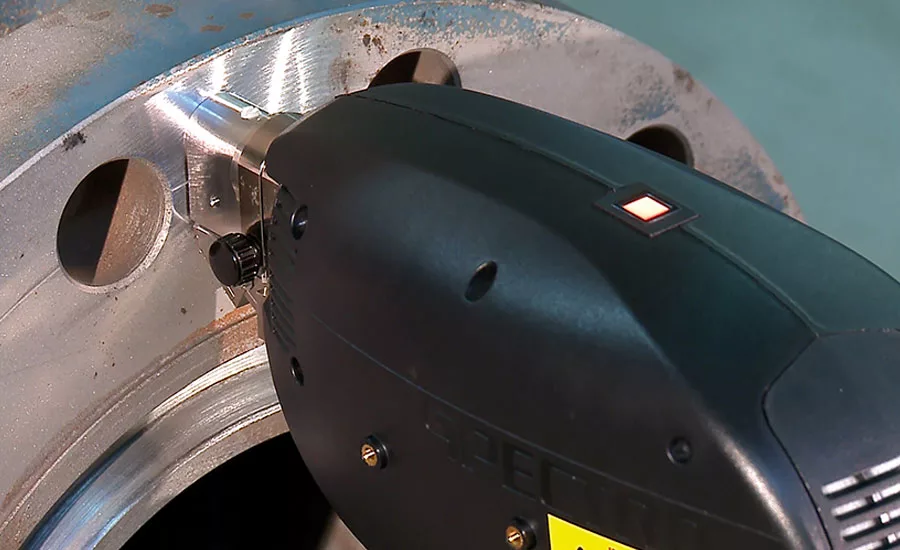
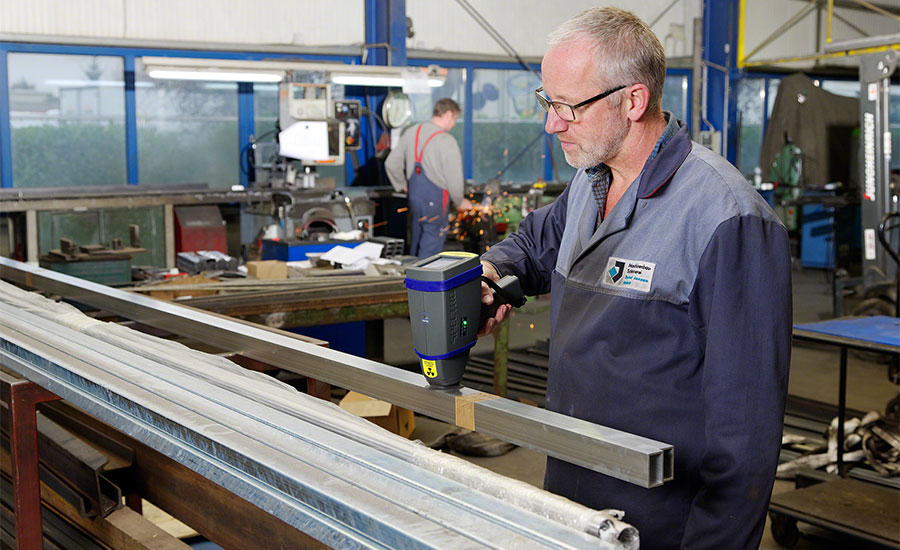
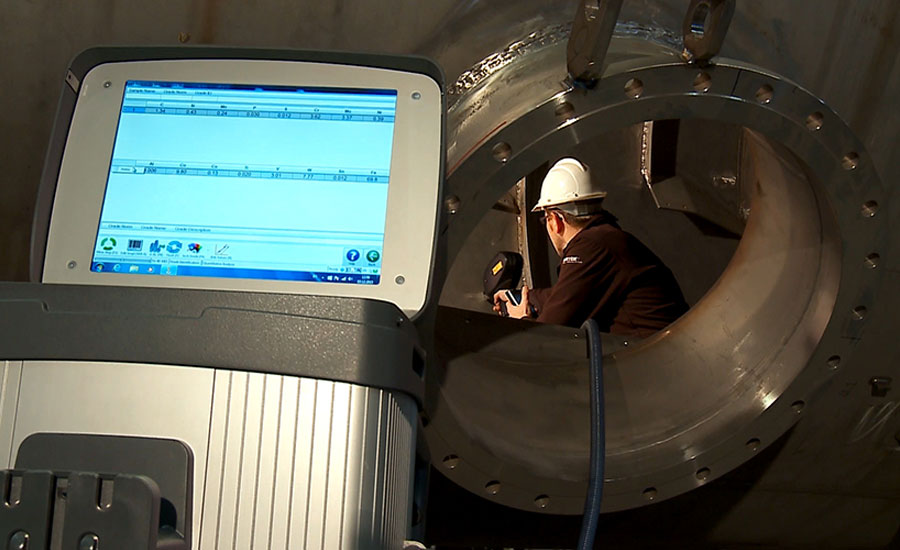
PMI works to preclude corrosion in industrial facilities. Whether it is performed by plant personnel or by service contractors, PMI demands have resulted in the analysis of massive volumes of steel piping and other components. These analyses must be made on the spot, quickly and easily, so when inappropriate materials are detected, corrosion-resistant components can be substituted and/or installed instead.
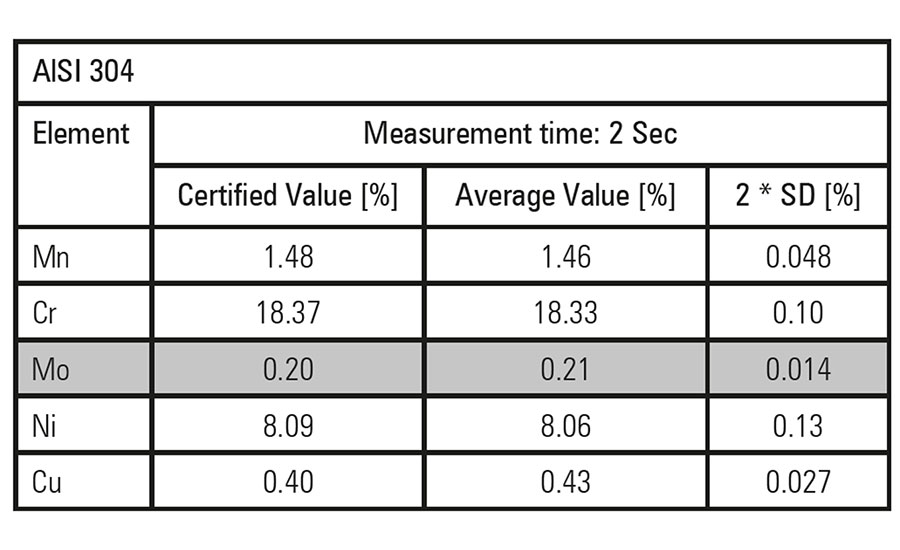
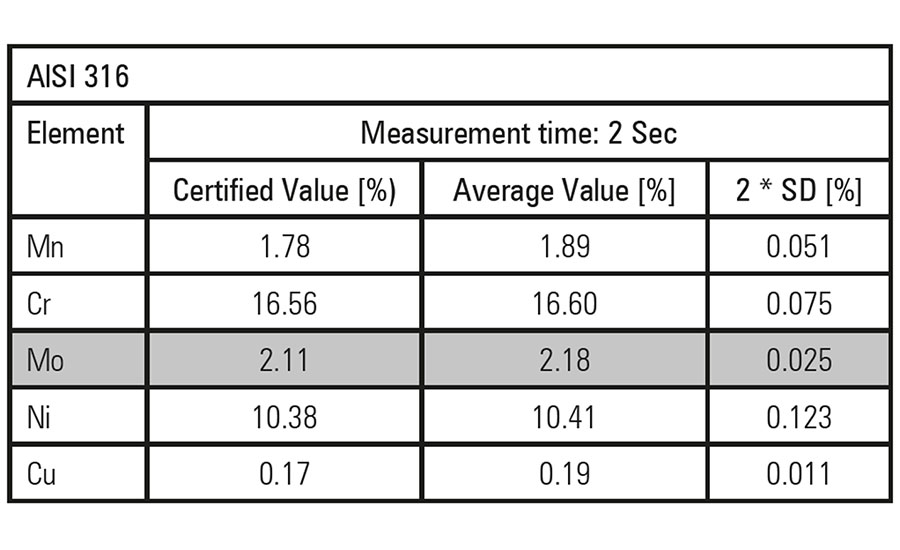
↑These charts show the differences in molybdenum content for Types 304 and 316 stainless steel as measured by an XRF spectrometer.↓
Traditional analytical techniques involve taking a process sample and then subjecting it to analysis in a laboratory. However, the use of laboratory instruments is both time consuming and expensive, as well as impractical for installed components. Inspection of installed components almost always involves delays and other expenses and may well be difficult or impossible while a plant is in operation. Shutting down an oil refinery to take a metal sample is hardly a realistic proposition. To solve this challenge, instrument makers have developed solutions that are now embodied in various handheld XRF analyzers.
Minor compositional differences may significantly affect performance
Among the most popular steels for refinery and chemical plant construction is Type 304 stainless steel. This standard austenitic chrome-nickel steel alloy is characterized by high corrosion resistance and considered practically indestructible. This steel is particularly suitable for vessels and piping used to contain aggressive liquids at high temperatures and pressures. However, it is not a universal solution. Hot acetic acid causes accelerated corrosion of Type 304 steel. With a higher molybdenum content, Type 316 stainless steel is more resistant to this corrosion and the preferred choice.
The presence of other elements, such as silicon and chromium, can result in corrosion in carbon steel in respectively low-alloy steels. In the presence of H2-free hydrocarbons with sulfur compounds, carbon steels with a silicon content below 0.1% experience a high rate of corrosion. Steel grades with higher silicon levels experience much lower corrosion rates.
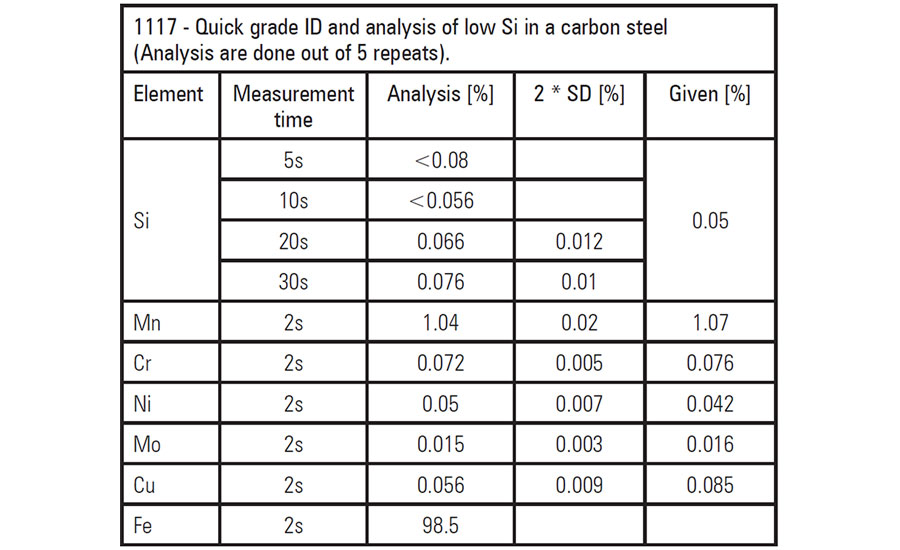
This chart shows critically low levels for silicon and chromium in carbon steel as measured with an XRF spectrometer.
In another instance, flow-accelerated corrosion (FAC) occurs in carbon steels. Even relatively low levels of chromium (in combination with alloying elements of copper and molybdenum) have been shown to slow down or effectively prevent this process. However, chrome also can go too low. Chromium concentrations below 0.1% don’t significantly hinder FAC.
Carbon content consequences
In many instances, handheld analyzers are not able to fulfill 100% of the material testing requirements for incoming or outgoing inspection and for the complete metal analysis. Handheld technology faces significant limitations identifying certain elements. With these constraints, it is often difficult or impossible to get satisfactory performance from handhelds in many applications.
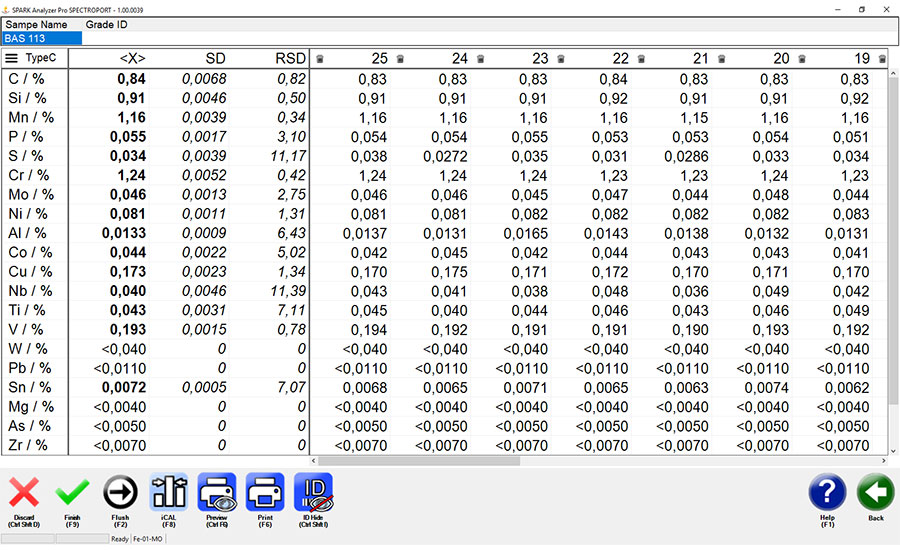
↑ Measured with a mobile metal analyzer, 25 measurements, measurement time 10 seconds, showing high-precision identification of carbon, phosphorous and sulfur . ↓
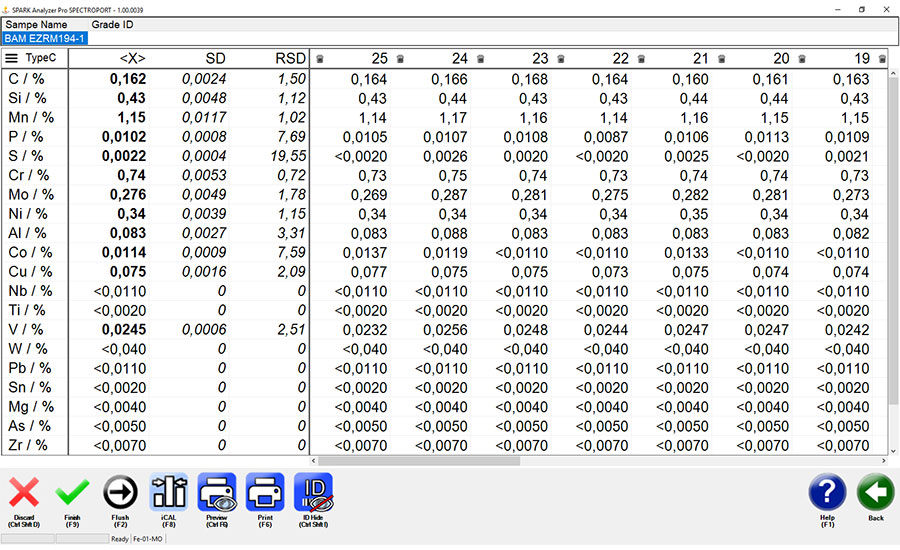
Carbon, sulfur, phosphorus, aluminum, silicon, magnesium, lithium, beryllium and boron all present challenges for XRF handhelds. Handheld OES analyzers also are limited for many applications since they have much higher detection limits than portable and mobile OES analyzers. A core problem is that handheld analyzers lack the ability to identify an element with the precision required for such elements as carbon, phosphorus and sulfur.
In formulating different steel grades, the amount of carbon usually is determined by following certain fundamental principles. For example, as carbon content rises, hardness and strength can increase (with heat treating), but ductility and weldability decrease. So, for many applications, if a user doesn’t know the carbon content, they won’t be able to exactly determine a steel’s performance properties.
Unfortunately, off-spec or even counterfeit materials increasingly are a concern for supply chains worldwide. Suppliers must ascertain that they process and ship steel products that are of the correct grade and composition ordered by their customers. Recipients of the products or components also must likewise check deliveries to make sure they have received exactly what they ordered. Additionally, where safety is a concern, many safety programs require checking, verifying and documenting steel materials for carbon content as well as the levels of many other elements, often including sulfur and phosphorus.
Steel and other metal materials need to be adequately identified and sorted throughout their production and use.
Although often kept quiet (for the sake of a supplier’s reputation or a fear of damaging important customer relationships), a single off-spec sample or a simple mix-up in delivered material—one that’s not detected by properly checking steel carbon levels—can have serious consequences. Those consequences can range from unnecessary delays, material rework or a catastrophic failure of plant equipment or a structural member.
Weldability is a key characteristic for low-alloy steels used in structures, vessels, vehicles, or machines. Steel alloys are weldable without special measures when they contain up to about 0.2% carbon. However, after that point, weldability decreases as carbon content increases. Applications involving highly stressed components, such as axles, shafts, and gears, require heat-treated steels. Surface-hardened steels especially offer increased wear resistance. Evaluating steel to determine its capacity for hardening treatment requires chemical analyses that include a precise measurement for carbon.
Examples of these steel grades include C45E (1.1191), 25CrMo4 (1.7218), and 42 CrMo4 (1.7225). The carbon content of heat-treated steels like these is typically between about 0.20% and 0.60%. For example, 25CrMo4 has a lower strength value than 42CrMo4, but it is their carbon content that is the only differentiator. Adjusting the carbon content, in combination with the concentrations of elements such as chromium, molybdenum, and vanadium, helps control the effective hardening depth of the steel.
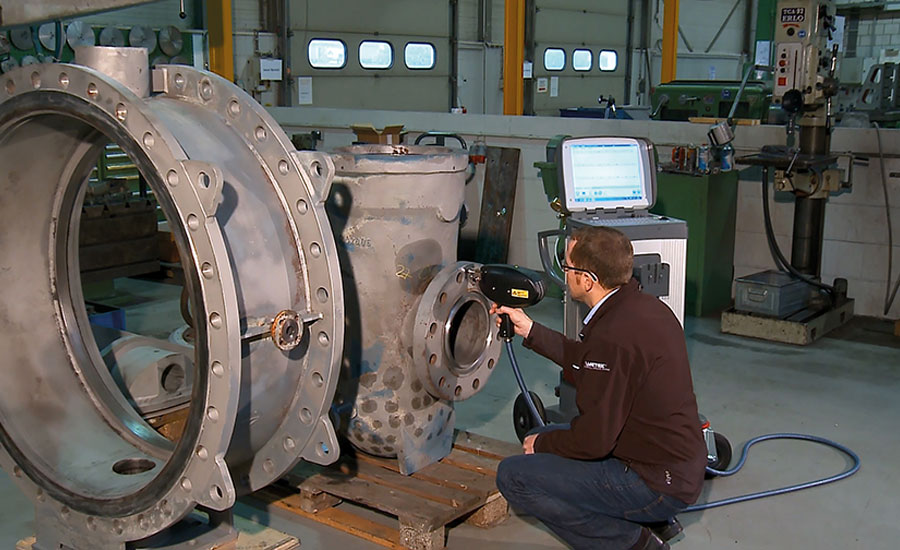
Arc/spark mobile metal analyzers offer precise metal compositional analysis without compromise.
Without having a knowledge of a steel’s carbon content, users can not be confident their products are safe. What if the weld seam tears? To escape component failures, costly rework, or worse—and in view of widespread producer liability regulation—an understanding of carbon content is essential.
In the previous PMI example—critical low levels for silicon and chromium in carbon steels—the purpose for the testing was to do a quick check as far as corrosion resistance. But what about weldability?
Fortunately, recent technology advances have resulted in highly capable mobile and/or portable OES metal analyzers that can quickly and precisely measure the carbon (sulfur, phosphorus) content of steel or provide fast alloy sorting based on carbon content on the dock or at the line.
Returning to PMI, handheld XRF analyzers can be used to separate Type 316 stainless steels from Type 304 steel and others but can’t be used to separate different grades of Type 316 stainless steel. This differentiation is critical because the steel’s mechanical strength and durability depends on its carbon content. Type 316 stainless steel contains up to 0.07% carbon, whereas 316L contains a maximum of only 0.03%. This small absolute difference is enough to give each alloy clearly different intergranular corrosion behavior. Welded seams formed with low-carbon 316L are more durable than welds with the higher-carbon alloy.
Handheld XRF analyzers will identify metal grades with quite high sulfur values, such as Type 303 steel, which contains a minimum of 0.15% sulfur. By contrast, Type 304 or 316 chrome-nickel steels have a maximum of 0.03% sulfur. Such low concentrations cannot be reliably detected. Handheld OES analyzers that are not able to measure sulfur (phosphorus) respectively won’t be able to deliver the performance required.
Without having a knowledge of a steel’s carbon content, users can not be confident their products are safe.
XRF and OES
Both XRF and OES analyze a material’s internal atomic composition. A sample’s atoms are excited using an external energy source, which is absorbed by and raises the energy level of the electrons in the sample. This excited state is unstable, so as the electrons rapidly return to their normal state, energy is emitted as they do so.
This emitted energy, or emission spectrum, is characteristic of the elements contained within the sample. The energy’s intensity is proportional to the concentration levels of the elements. XRF and OES differ in the type of energy used to excite the sample atoms. With the former, the energy comes from a beam of X-rays; in the latter, an electric arc or spark is the energy source.
Instrument manufacturers have come a long way in employing both XRF and OES techniques in a growing range of devices that are more capable and easier to use. However, even with the continual improvements made to these devices, it is still very important for material suppliers and end users to understand the capabilities and limitations of each technique to ensure their proper use in identifying key characteristics of steel and other materials.
Looking for a reprint of this article?
From high-res PDFs to custom plaques, order your copy today!


