Hidden Waviness: When Measuring Roughness Cannot Solve Quality Challenges
Roughness and waviness are dictated by each particular application.
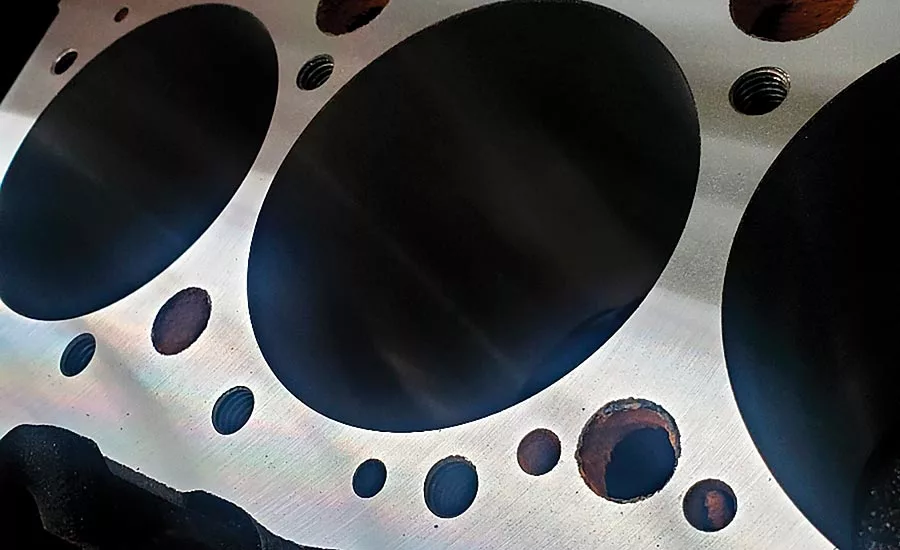
Figure 1. Will a gasket seal with this surface? The answer may not be found in the roughness, but in the longer-wavelength waviness. Courtesy QMP Racing
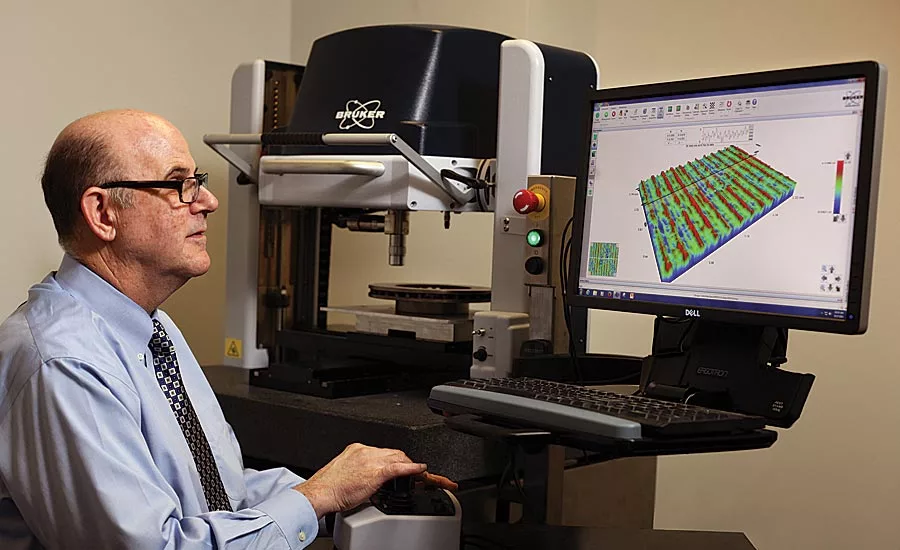
Figure 2. Unlike early equipment, modern measurement instruments, such as this Bruker 3D optical profiler, provide ample lateral and vertical range to measure longer wavelength waviness as well as roughness. Courtesy of Michigan Metrology
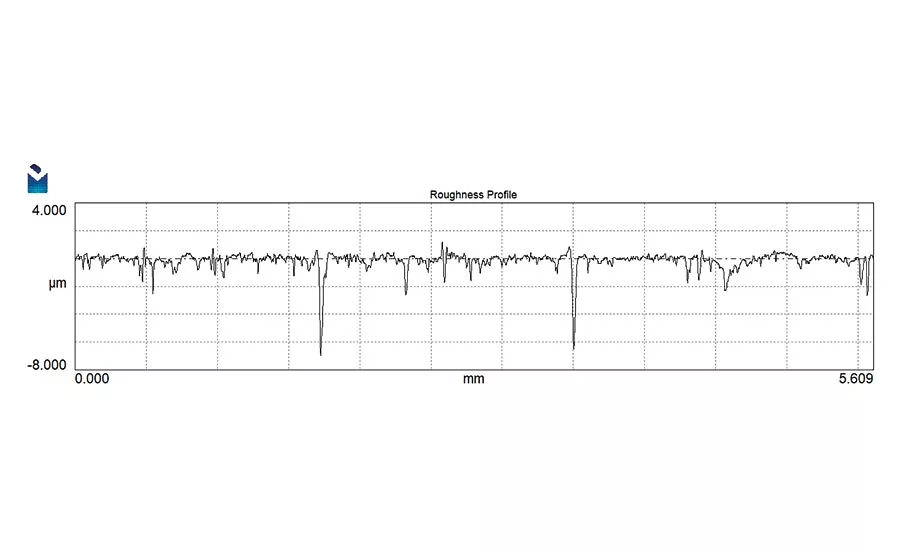
Figure 3. This roughness profile (shown in OmniSurf profiling software) gives no indication why some parts leaked while others sealed. Courtesy of Digital Metrology Solutions
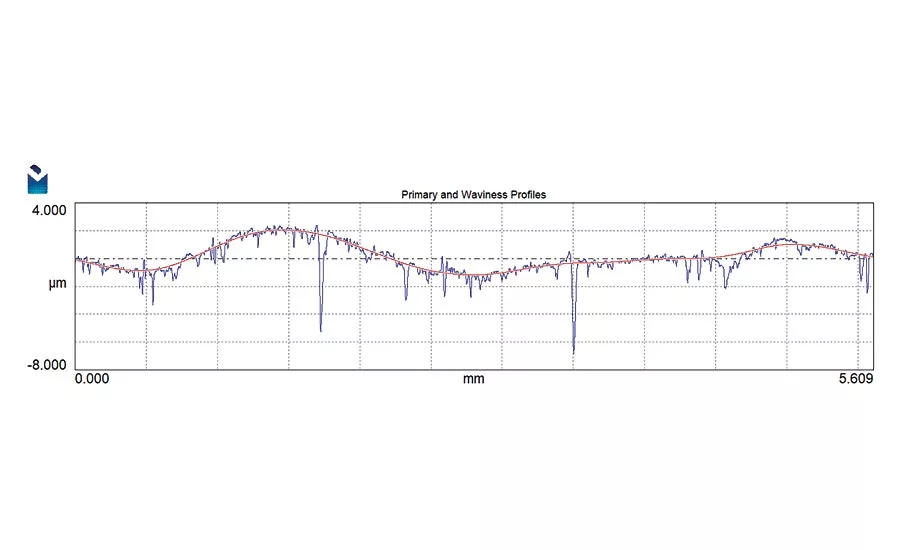
Figure 4. The issue with sealing was found to be due to large height variations over several millimeters: the domain of waviness, shown in red via OmniSurf software. Courtesy of Digital Metrology Solutions
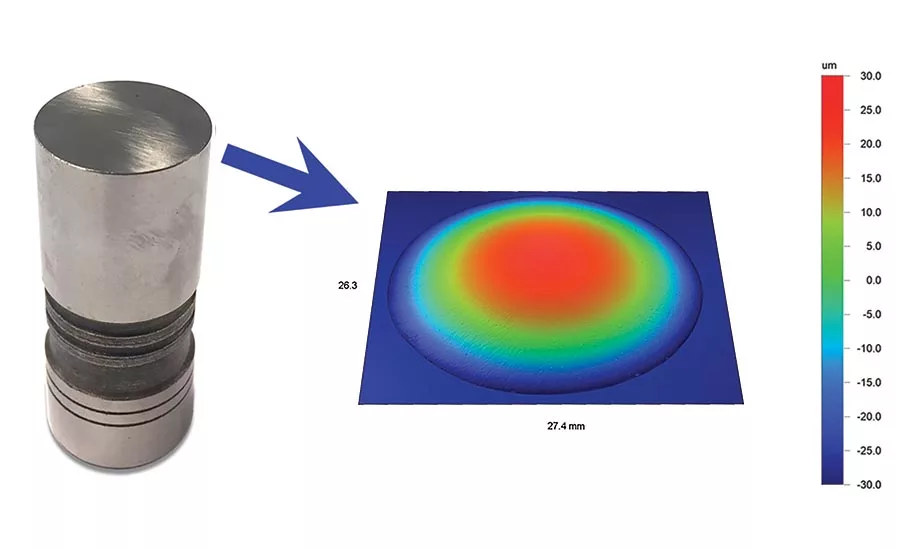
Figure 5. The surface of an engine lifter is typically ground with a crown shape to decrease stress. Courtesy of Michigan Metrology
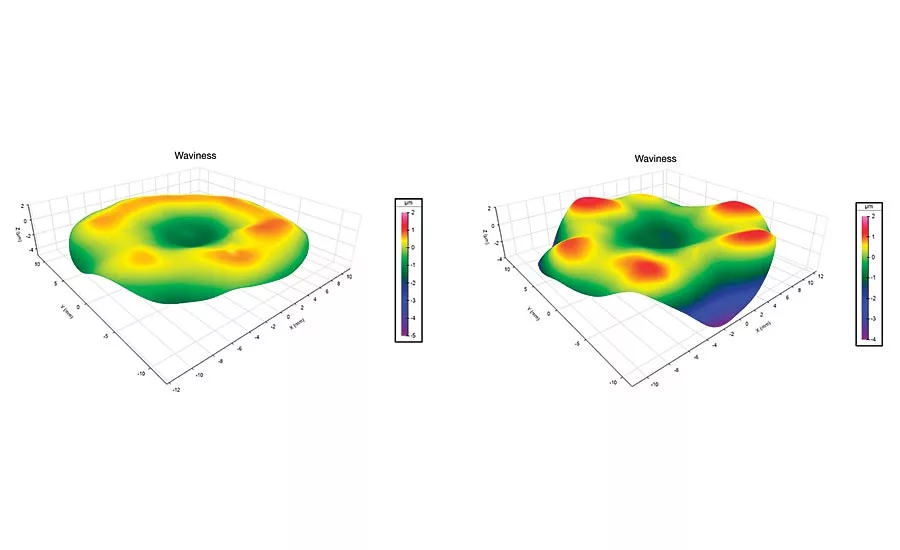
Figure 6. Unlike a smoothly crowned lifter (left), a lifter with pronounced waviness (right) led to engine noise. The source of the shape was later traced to a grinding process. Courtesy of Digital Metrology Solutions
Specifications for surface texture frequently focus on surface “roughness”—the finer structures in the texture—often to the exclusion of the “waviness”—the larger structure of the texture. Unfortunately, problems related to sealing, vibration, noise, wear, etc., are regularly caused by issues hidden in the waviness domain, which cannot be captured by common roughness specifications.
Roughness vs. Waviness
The distinction between roughness and waviness helps us understand the makeup of a surface’s texture and how that texture will affect the surface’s performance.
We define roughness and waviness by specifying ranges of “spatial wavelengths” within the texture. Spatial wavelengths are lateral spacings along the surface, rather than heights; shorter spatial wavelengths are typically described as roughness, while longer wavelengths may be considered waviness (with very long wavelengths being considered “form”).
Roughness and waviness, however, are not defined in absolute terms; they are dictated by each particular application. The wavelengths corresponding to roughness and waviness of, say, a machined engine block, will be vastly larger than those we might measure for a highly polished optical surface (and therefore meaningless for the latter application).
How we define “roughness” and “waviness,” then, must also be based on the intended function. We use “cutoff wavelengths” to designate the separation of roughness and waviness as they pertain to a given application. In fact, many measurement standards require cutoffs as part of any specification for roughness or waviness.
Why we Specify Roughness vs. Waviness
Much of the bias toward measuring roughness is based in our measurement equipment. Early, stylus-based systems gave us our first quantitative texture data. These systems, however, were limited to short spatial wavelength measurements and limited vertical range, limiting measurements to short traces over generally flat surfaces. During that time, the texture we could control was the texture we could measure: shorter wavelength roughness.
As measurement technologies have matured, lateral and vertical ranges have grown, letting us easily quantify larger wavelengths. Stylus traces of hundreds of millimeters are now possible. Three-dimensional measurement instruments with stitching algorithms let us combine individual measurements into very large datasets, showing us waviness in all directions.
Nevertheless, despite the wealth of surface information available from modern instruments, most designers still specify surfaces using only one or two basic parameters such as Ra (average roughness) or Rz (the average maximum profile height). To verify these surfaces, quality professionals zoom in to small areas in order to acquire the roughness measurement in great detail—and, in doing so, they sometimes miss the bigger picture. They measure the grass but not the mountains.
What is Hiding in the Waviness?
While roughness measurement clearly is important, it cannot prevent problems that lurk outside the roughness wavelength regime. As an example: an engine manufacturer found that a particular component was prone to leaking. A sampling of the parts was measured with a stylus profiler, and the profiler data was filtered to show the roughness (Figure 3). The average roughness met specification in all of the parts. So what was the problem?
When the data was filtered to show longer wavelengths (Figure 4), several parts exhibited waviness variation heights of several microns over distances of several millimeters. This waviness was determined to be the source of the leakage, and specifications were added to control the waviness as well as the roughness.
As a second example: an engine lifter is designed to follow the lobe of a cam in order to open and close the engine valves. Typically, the lifter is ground with a spherical crown shape to decrease contact stress (Figure 5).
A manufacturer found that a subset of lifters was causing significant engine noise. As in the earlier example, the roughness on a sample of lifters was measured, and all parts were found to be within tolerance.
When the data was filtered to show the waviness, however, two distinct groups of parts emerged. The surfaces of those that performed quietly appeared flat after filtering was applied (Figure 6, left). Those that were noisy exhibited “lobing,” or periodic waviness around the lifter surface (Figure 6, right).
In diagnosing the problem, engineers determined that a grinding process was imparting a very subtle degree of lobing around the lifter head that was not obvious in the general shape measurement. The lobing was revealed when the 3D texture data was filtered to remove the spherical shape and the underlaying fine texture. This level of surface texture analysis gave engineers the data they needed to eliminate the noise source.
Controlling Waviness
Issues of waviness can lead to poor performance, premature wear, problems with finishes and coatings, and other quality issues. Unfortunately, waviness requirements are not typically considered in product design and development. As a result, the impact of waviness is not realized until components fail for seemingly “unknown” reasons. Armed with high quality measurement data, accurate analysis software, and a thorough understanding of wavelengths and filtering, engineers can determine problems hidden in waviness and can root out their sources before they lead to trouble in the field.
Looking for a reprint of this article?
From high-res PDFs to custom plaques, order your copy today!


