Sponsored Content
Detect Small Shifts in the Process Mean with Exponentially Weighted Moving Average (EWMA) Charts
Quickly detecting small shifts in mature or highly sensitive processes is where the EWMA control chart really shines.

Control charts are specialized time series plots that help you determine if a process is in statistical control. Although some of the most widely used ones like Xbar-R and Individuals charts are great at detecting relatively large shifts in the process (1.5+ sigma shifts), you will need something different for smaller shifts. Enter the Exponentially Weighted Moving Average (EWMA) chart.

Some of the important properties of EWMA charts are:
- They incorporate data from all previous points in each subsequent plotted point. So, all the data is used for calculating the points plotted in the chart.
- Data can be collected individually or in subgroups.
- They are not sensitive to the assumption of normality.
But the biggest advantage the EWMA chart is you can use it to detect small shifts in the process mean. This is important because early detection helps you react faster and fix the process.
EWMA VS. INDIVIDUALS CHART FOR DETECTING SMALL PROCESS SHIFTS
Let’s say a manufacturer of small polypropylene spigots wants to use process control charting to monitor tensile pull strength. The manufacturer is concerned about the possibility of small shifts in the mean.
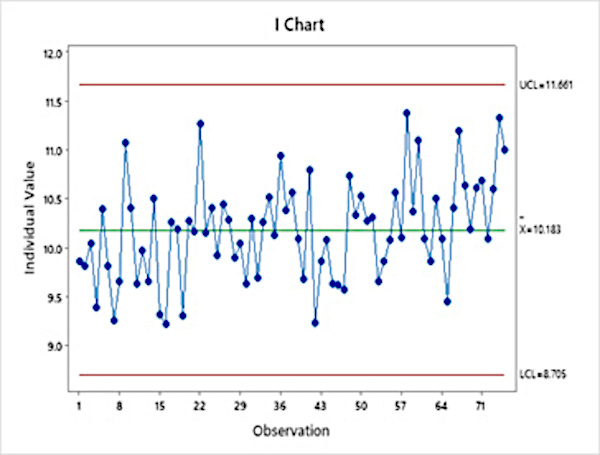
An Individuals control chart for the data shows the process in control. However, there does appear to be a small shift in the process around observation 66.
For the same process data, the EWMA control chart flags the last data point as out of control.
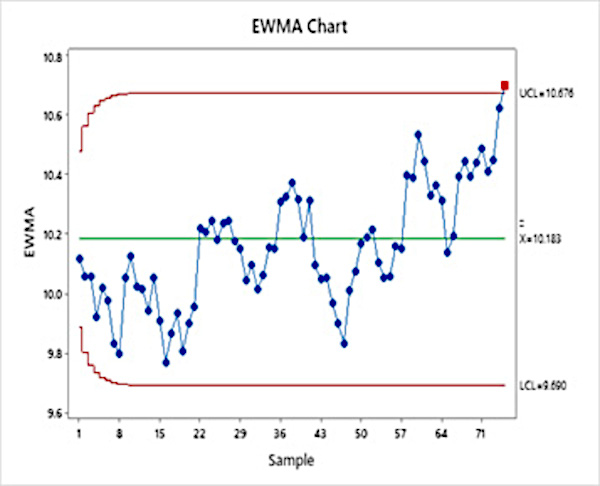
The engineers can investigate the process for possible special causes that are affecting the process mean and eliminate them.
WHERE COULD YOU USE THE EWMA CONTROL CHART?
The same concept could apply to numerous metrics you're tracking at your organization. Although a signal on an I-Chart may let you know of a sudden, extreme shift or event, the EWMA will likely reveal if the process has drifted slightly from being centered (assuming it was centered to begin with) and product quality has deteriorated. Think of where you might apply this tool on a chart you are already using, to learn more from your process!
It is important to use control charts to monitor process characteristics. Choosing the correct control chart will better assist companies in detecting processes shifts when they are present. Traditional control charts are effective for large shifts in the process. Quickly detecting small shifts in mature or highly sensitive processes is where the EWMA control chart really shines.
Real-Time SPC Powered by Minitab® makes quality analysis and improvement easy in one convenient and comprehensive solution, while our monitoring and alerts in real-time allow for immediate action when quality varies, saving both time and money. Visit our website to learn more.
Looking for a reprint of this article?
From high-res PDFs to custom plaques, order your copy today!


