Brain Teasers: Cost of Tightened Specifications
Anyone
who has faced a production problem with a need to solve it by using production
data can relate to the notion of a brain teaser. The brain teasers presented
here are based on real-world situations encountered by workers in manufacturing
environments. The brain teasers have three parts: (1) the situation, (2)
available data or other supporting information and (3) questions that various
workers need answered for continual improvement. Recommended solutions follow
in the next issue and on the Web at Quality Online (www.qualitymag.com).
 Q:
What can be learned from an analysis of the 50 days of calibration data on the
sizing scale?
Q:
What can be learned from an analysis of the 50 days of calibration data on the
sizing scale?
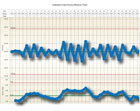
A: A process behavior chart shows the impact of adjusting the scale in the sizing machine without an understanding of the standard deviation of repeated measurements of the same unit (repeatability) for the scale. These daily values show a predominately zigzag pattern and the moving ranges show a cyclic pattern. Clearly, these patterns must be connected to specific causes. The standard deviation calculated from the average moving range is 1.864 which is inflated from the zigzag pattern, while the calculation = 1.261. The measurement study will reveal just how much this latter value might be inflated.
Q: What do the data from the measurement study reveal about the scale and the operators?
A: The range chart of repeated measurements by each operator for the different weight standards shows a predictable amount of measurement process variation. The standard deviation of repeated measurements is 0.55, which is much lower than either standard deviation from the calibration data. Also, when the value of the different standard weights is subtracted from the data, a process behavior chart shows no difference in the operators or the standards. From 100 to 180, the scale is consistent.
Q: How do the results from the calibration data and the measurement study compare?
A: The measurement study shows a much lower standard deviation for the repeatability of the scale. The standard deviation from the calibration data is inflated by unnecessary adjustments to the scale.
 Q:
How can Fred explain the results from these two sets of data to Fiona and the
customer?
Q:
How can Fred explain the results from these two sets of data to Fiona and the
customer?
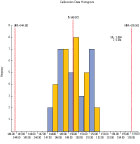
A: Fred can start the explanation by showing the process behavior chart from the measurement study that illustrates how well the scale works across the full range of weights. See the chart, “Measurement Study at Different Weights.” Fred also can show the histogram for the calibration data as well as the histograms for the measurement study where the values are represented as deviations from the standard value. See the two histograms, “Calibration Data Histogram” and “Measurement Study Histogram.” The data values on the histogram for the calibration data have more than twice the variation as do the values from the measurement study. This indicates that there is more than routine variation in the calibration data.
Situation
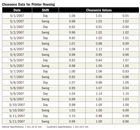
Wesley is a product engineer for a company that makes housings for a variety of printer manufacturers. Customers submit specifications for each critical characteristic and Wesley’s company automatically cuts the specifications to about 60% of what the customer sets. Production is then required to meet these tightened “internal” specifications for the housings. Difficulties occur when production cannot meet the internal specifications and Wesley tries to work out a solution. Until the conflict is resolved, all products that do not meet the internal specification must be reworked or sometimes scrapped even if the product meets the customer’s specification. The additional labor and material usage add cost to the product that production considers unnecessary. The most recent dispute involves a clearance between two parts of the housing and Wesley has not yet reached a resolution with production.Available data
The clearance specification involved in the dispute was set by the customer as 1 millimeter ±0.2 millimeter. The internal specification was set as 1 millimeter ±0.12 millimeter. Current clearance data for the past two weeks of production for this printer housing are summarized in the table, “Clearance Data for Printer Housing.”Questions
- What do the data provided reveal about
process behavior for clearance?
- What is the capability of clearance based on the specifications given
to production?
- Based on the customer’s requirements, what is the capability of
clearance?
- In what way is the company penalizing itself by working to the internal specifications? How can they evaluate the cost of this practice?
Answers to May Brain Teaser
Fiona is a production manager for a company that makes equipment that sorts product by weight. One customer says that the equipment does not always sort the product correctly and some product goes in the wrong bin. Fiona assigned a quality technician, Fred, to the customer to determine what is occurring and how to fix the machine.A: A process behavior chart shows the impact of adjusting the scale in the sizing machine without an understanding of the standard deviation of repeated measurements of the same unit (repeatability) for the scale. These daily values show a predominately zigzag pattern and the moving ranges show a cyclic pattern. Clearly, these patterns must be connected to specific causes. The standard deviation calculated from the average moving range is 1.864 which is inflated from the zigzag pattern, while the calculation = 1.261. The measurement study will reveal just how much this latter value might be inflated.
Q: What do the data from the measurement study reveal about the scale and the operators?
A: The range chart of repeated measurements by each operator for the different weight standards shows a predictable amount of measurement process variation. The standard deviation of repeated measurements is 0.55, which is much lower than either standard deviation from the calibration data. Also, when the value of the different standard weights is subtracted from the data, a process behavior chart shows no difference in the operators or the standards. From 100 to 180, the scale is consistent.
Q: How do the results from the calibration data and the measurement study compare?
A: The measurement study shows a much lower standard deviation for the repeatability of the scale. The standard deviation from the calibration data is inflated by unnecessary adjustments to the scale.
A: Fred can start the explanation by showing the process behavior chart from the measurement study that illustrates how well the scale works across the full range of weights. See the chart, “Measurement Study at Different Weights.” Fred also can show the histogram for the calibration data as well as the histograms for the measurement study where the values are represented as deviations from the standard value. See the two histograms, “Calibration Data Histogram” and “Measurement Study Histogram.” The data values on the histogram for the calibration data have more than twice the variation as do the values from the measurement study. This indicates that there is more than routine variation in the calibration data.
Looking for a reprint of this article?
From high-res PDFs to custom plaques, order your copy today!


