Brain Teasers: Correctly Investigating Causes of Failures
Anyone who has faced a production problem with a need to solve it by using production data can relate to the notion of a brain teaser. The brain teasers presented here are based on real-world situations encountered by workers in manufacturing environments. The brain teasers have three parts: (1) the situation, (2) available data or other supporting information, and (3) questions that various workers need answered for continual improvement. Recommended solutions follow in the next issue and on the Web at Quality Online (www.qualitymag.com).

For a particular product, Maria noticed that the Pareto chart for both shifts had the same cause of failure-shaft too short-as the highest bar. She instructs a process engineer to work with production to find the root cause of the short shafts and to recommend a solution to eliminate it.
For three weeks they investigated every unit that failed for short shaft. Then the process engineer filed a report on the suspected causes of the short shafts along with a proposed solution. Because the solution did not involve a capital expense, Maria gave permission immediately for its implementation. At a production meeting six weeks later, Maria reports that the highest cause of failures at final inspection is still short shafts. The improvement solution has been in place for four weeks, yet the data still indicate that the largest cause of failure of the product is still short shafts. Maria’s boss wants to know if the real root cause of short shafts has been found and, if so, why did the solution not work.
2. What is the behavior of shaft length based on the data provided from December 15 to 17?
3. What is the capability of the shaft lengths and what should be the focus of activities to improve this characteristic?
4. Why is it difficult to determine real root causes of failures by inspecting only the units that fail?

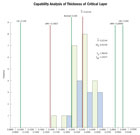
Q: What is the current behavior and capability of the thickness of the layer in question based on the data collected for November 5 and 6?
A: Using the data collected by Jake and analyzed on an average and range chart, the process behaves predictability at an average thickness of 0.22 millimeter with a moving range of 0.024 millimeter and a standard deviation of 0.021 millimeter that give natural process limits of individual values of 0.1583 millimeter to 0.2846 millimeter. The capability analysis gives values of Cp and Cpk of 1.58 and 1.24, respectively. See the graphs, “Thickness of Critical Layer” and “Capability Analysis of Thickness of Critical Layer.” The process average is not on target because Cpk is lower than Cp. The capability analysis shows that the process average is higher than the target.
 Q: What is the potential for reducing the average thickness for this layer of the product?
A: The LNPL (Lower Natural Process Limit) is 0.1583 millimeter. This number is 0.0583 divided by 0.021 = 2.77 standard deviations above the lower specification limit. Also, the process average is on the high side of the nominal and could be lowered.
Q: If Russell recommends that production reduce the average thickness of this layer, what concerns must be addressed to ensure that the thickness meets the minimum specification?
A: One way to ensure that the thickness meets the minimum specification is to target a Cpk that is greater than 1. A typical target in such cases is a Cpk of 1.33. To achieve this value and yet reduce the material cost for this critical layer, Russell recommends lowering the process average to a point that is 4 standard deviations above the lower specification limit. This gives a target average of 0.10 + 4 x 0.021 = 0.184 millimeter.
Situation
As the process engineering manager for her company, Maria’s responsibilities include determining the causes of product failures at final inspection. Only pass/fail data are recorded for all of the critical characteristics checked at this inspection location. Summaries include total parts per million defective (PPM) and the Pareto chart of number of failures for each characteristic. Using the Pareto chart results, Maria assigns an engineering team to find the root cause of the characteristics with the highest number of failures.For a particular product, Maria noticed that the Pareto chart for both shifts had the same cause of failure-shaft too short-as the highest bar. She instructs a process engineer to work with production to find the root cause of the short shafts and to recommend a solution to eliminate it.
For three weeks they investigated every unit that failed for short shaft. Then the process engineer filed a report on the suspected causes of the short shafts along with a proposed solution. Because the solution did not involve a capital expense, Maria gave permission immediately for its implementation. At a production meeting six weeks later, Maria reports that the highest cause of failures at final inspection is still short shafts. The improvement solution has been in place for four weeks, yet the data still indicate that the largest cause of failure of the product is still short shafts. Maria’s boss wants to know if the real root cause of short shafts has been found and, if so, why did the solution not work.
Available Data
Data on weekly PPM for short shaft length are shown for the past 10 weeks in the table, “PPM for Short Shafts.” Actual shaft length for a week’s production is summarized in the table, “Shaft Length.”Questions
1. Based on the PPM data provided for short shafts, what PPM can be expected for product failures due to short shafts if the root causes are not found and eliminated?2. What is the behavior of shaft length based on the data provided from December 15 to 17?
3. What is the capability of the shaft lengths and what should be the focus of activities to improve this characteristic?
4. Why is it difficult to determine real root causes of failures by inspecting only the units that fail?
Answers to February Brain Teaser
Russell’s company makes a high-volume blow-molded container with multiple layers, one of which is very costly. His boss has challenged Russell to determine how to lower the average thickness for this expensive layer of material and still meet the specifications. Jake, the quality manager, could not locate actual thickness data for this layer of the containers. He set up a data collection plan to measure thickness for one container from each of the two cavities every two hours.Q: What is the current behavior and capability of the thickness of the layer in question based on the data collected for November 5 and 6?
A: Using the data collected by Jake and analyzed on an average and range chart, the process behaves predictability at an average thickness of 0.22 millimeter with a moving range of 0.024 millimeter and a standard deviation of 0.021 millimeter that give natural process limits of individual values of 0.1583 millimeter to 0.2846 millimeter. The capability analysis gives values of Cp and Cpk of 1.58 and 1.24, respectively. See the graphs, “Thickness of Critical Layer” and “Capability Analysis of Thickness of Critical Layer.” The process average is not on target because Cpk is lower than Cp. The capability analysis shows that the process average is higher than the target.
A: The LNPL (Lower Natural Process Limit) is 0.1583 millimeter. This number is 0.0583 divided by 0.021 = 2.77 standard deviations above the lower specification limit. Also, the process average is on the high side of the nominal and could be lowered.
Q: If Russell recommends that production reduce the average thickness of this layer, what concerns must be addressed to ensure that the thickness meets the minimum specification?
A: One way to ensure that the thickness meets the minimum specification is to target a Cpk that is greater than 1. A typical target in such cases is a Cpk of 1.33. To achieve this value and yet reduce the material cost for this critical layer, Russell recommends lowering the process average to a point that is 4 standard deviations above the lower specification limit. This gives a target average of 0.10 + 4 x 0.021 = 0.184 millimeter.
Looking for a reprint of this article?
From high-res PDFs to custom plaques, order your copy today!


