Quality Magazine logo
search
cart
facebook twitter linkedin youtube
  • Sign In
  • Create Account
  • Sign Out
  • My Account
Quality Magazine logo
  • NEWS
  • PRODUCTS
    • FEATURED PRODUCTS
    • SUBMIT YOUR PRODUCT
  • CHANNELS
    • AUTOMATION
    • MANAGEMENT
    • MEASUREMENT
    • NDT
    • QUALITY 101
    • SOFTWARE
    • TEST & INSPECTION
    • VISION & SENSORS
  • MARKETS
    • AEROSPACE
    • AUTOMOTIVE
    • ENERGY
    • GREEN MANUFACTURING
    • MEDICAL
  • MEDIA
    • A WORD ON QUALITY PUZZLE
    • EBOOK
    • PODCASTS
    • VIDEOS
    • WEBINARS
  • EVENTS
    • EVENT CALENDAR
    • IMTS
  • DIRECTORIES
    • BUYERS GUIDE >
      • Supplier Insights
    • NDT SOURCEBOOK
    • VISION & SENSORS
    • TAKE A TOUR
  • INFOCENTERS
    • Digital Quality Management Systems
    • NEXT GENERATION SPC & QUALITY ANALYTICS
  • AWARDS
    • ROOKIE OF THE YEAR
    • PLANT OF THE YEAR
    • PROFESSIONAL OF THE YEAR
  • MORE
    • Expert Columns
    • NEWSLETTERS
    • QUALITY STORE
    • INDUSTRY LINKS
    • SPONSOR INSIGHTS
  • EMAG
    • eMAGAZINE
    • ARCHIVES
    • CONTACT
    • ADVERTISE
  • SIGN UP!

Brain Teasers: Is Repair of Parts Too Costly?

By Dr. Sophronia Ward
October 1, 2006
Anyone who has faced a production problem with a need to solve it by using production data can relate to the notion of a brain teaser. The brain teasers presented here are based on real-world situations encountered by workers in manufacturing environments. The brain teasers have three parts: (1) the situation, (2) available data or other supporting information and (3) questions that various workers need answered for continual improvement.

Situation

A manufacturer of computer parts, such as hard drives and CD/DVD drives, will repair or replace all parts that fail within the first year. Turn-around time for this service is guaranteed at 24 hours. Typically, a replacement part is sent out the day the failed part is received. The replacement part may be new or a refurbished part that was returned earlier by another customer. Returned parts are sent to diagnostics and rework.

Juan manages the department that handles all returns, replacements and repairs. He is under pressure to reduce the costs in his department. These costs include labor, new units from production and some materials for repairs. To study the costs in detail, Juan has decided to focus on the time to find and repair returned units, the percentage of returned units that cannot be repaired and the number of new units used for returns. His challenge is to minimize the costs associated with his department while providing the best customer service.


Available Data

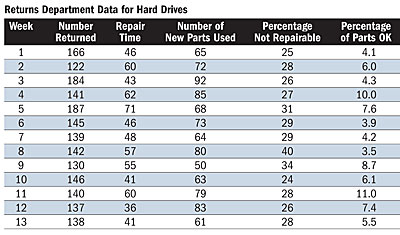
Juan decided to concentrate on the part with the highest volume of returns-computer hard drives because the major costs are associated with the labor to find and correct the component failure regardless of the component type. He has received data for the past 13 weeks on the following measures for hard drives: number of returned parts, time to identify the failure and repair the returned parts, number of new parts shipped as replacements, percentage of parts that cannot be repaired and percentage of returned parts that work correctly. These data are summarized in the table, "Returns Department Data for Hard Drives."


Questions

1. What is the behavior of the returns and repair processes for hard drives?

2. How does understanding process behavior help Juan to evaluate possible ways to reduce costs?

3. Based on the data available, what might Juan work on first to reduce costs?

4. What additional data and analyses could help Juan take actions to reduce costs in his department?


Answers to September Brain Teaser

As a new Six Sigma Black Belt for a sand casting manufacturer, Vicky spent the first few weeks reviewing the results of completed Six Sigma projects. She focused on the control plans that typically use process behavior charts for critical measures to ensure that project gains are sustained. Vicky has noticed that the limits used on some process behavior charts have not been updated to reflect current process behavior. She selected the chart for sand temperature to discuss with the corporate quality director.


Q: How can the data, central line and limits provided for sand temperature be used to make the process behavior chart?

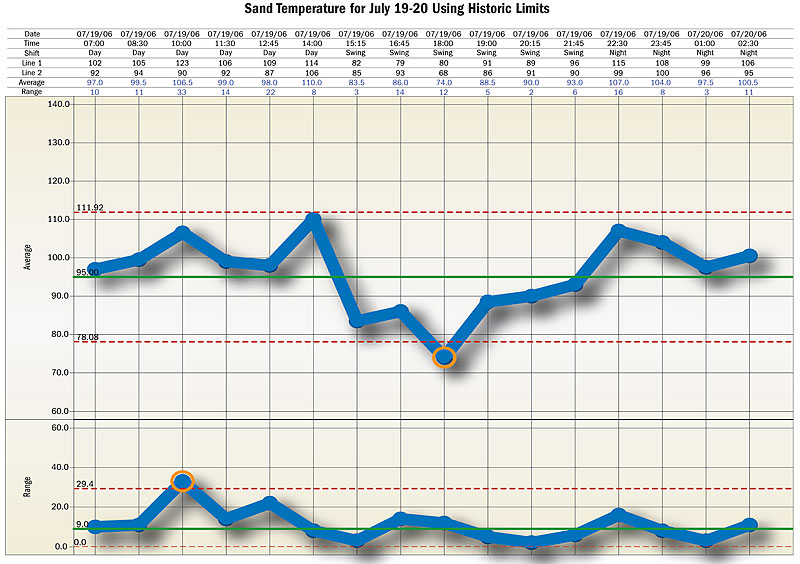
A: To recreate the process behavior chart for sand temperature that Vicky was given, use the control limits provided and plot the data for the three shifts on July 19-20 in subgroups of size 2. See the chart, "Sand Temperature for July 19-20 Using Historic Limits."


Q: What conclusions can be made about the behavior of sand temperature with the current central line and limits?

A: Using the limits provided, the July 19-20 data show two signals of exceptional variation: a point below the lower control limit on the average chart during the swing shift and a point above the upper control limit on the range chart during the day shift. Based on these historic limits, sand temperature is not predictable. It shows a decrease in the average for swing shift and an increase in variation during day shift. Vicky has noticed other signals with previous data, but as far as she can tell, there has been no effort to identify and remove the exceptional causes.

An additional issue regarding sand temperature is that of the two lines. In reality, these are two different processes and Vicky needs to analyze the data from each line separately to find out if both lines have the same average and variation.

It turns out that both lines have similar amounts of variation, but the average for Line 2 is approximately 8.5 degrees or about 1 standard deviation lower than Line 1. In the future, it is advisable to use separate process behavior charts for real-time control for each line since they are separate processes.


Q: If the intent in the control plan for sand temperature is to have a real-time response and action plan, what specific situations need to be addressed?

A: The first level of response is to notice the presence of a signal on the chart as soon as the signal appears and then determine appropriate immediate action. If the cause of the exception is easily identified, then take immediate action to remove the cause of the exception. If the cause of the exception is not obvious, take action as needed to bring the process back into a predictable state. The second level of response is to find the cause of the exceptional variation and take actions to remove that cause from the process.

Causes of exceptional variation in the average sand temperature can be a simple as an incorrect setup or as complex as a malfunction in the performance of the temperature equipment. Regardless, control plans with real-time responses to data plotted on a process behavior chart require the users to take appropriate actions to remove the causes of the exceptional variation in the process. Some of these actions may be included as part of the control plan.

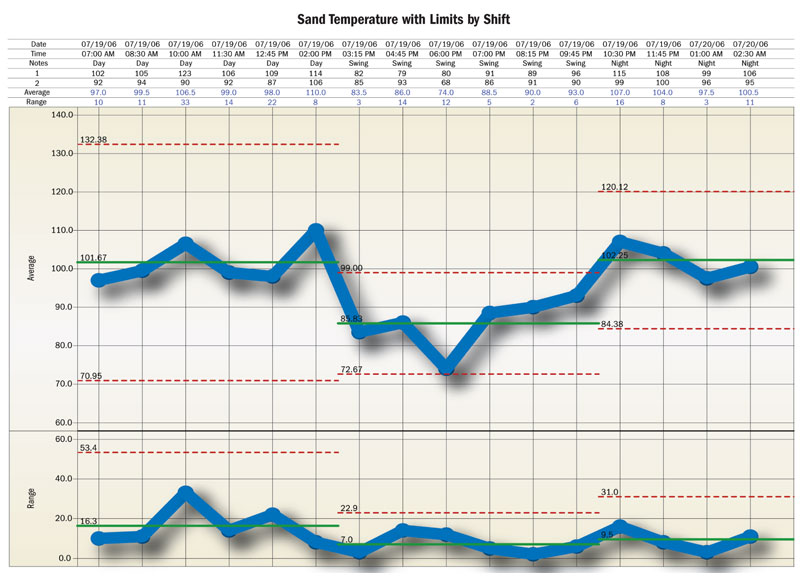
For the July 19-20 data, it is appropriate to compute limits for each shift because day and swing shifts had different signals. These separate sets of limits show that day shift has much higher variation than the other two shifts while swing shift has an average that is about 15 degrees below the average for the other two shifts. See the chart, "Sand Temperature with Limits by Shift." From this analysis of the data, Vicky can begin a search for the causes of the exceptional variation.


Q: How should Vicky proceed with the review of control plans for other measures of this process as well as other processes?

A: As a first action, Vicky should propose that she lead a team of four to five people to review all of the control plans from Six Sigma projects, including a review of the way process behavior charts are currently set up. Members of this team should include several leaders of the Six Sigma projects and several people who are responsible for using the control plans. The goal of this review team would be to make appropriate changes in the control plans so that real-time responses and actions will lead to finding and eliminating the causes of exceptional variation to ensure ongoing predictable processes.

Share This Story

Looking for a reprint of this article?
From high-res PDFs to custom plaques, order your copy today!

Qm0620 clmn ask the expert author sophronia ward 0620

Dr. Sophronia Ward, a PhD statistician and continual improvement specialist, has extensive experience in manufacturing, service and health CARE. [email protected], www.pinnaclepartnersinc.com, or (865) 310-2973.

Recommended Content

JOIN TODAY
to unlock your recommendations.

Already have an account? Sign In

  • 2024 Quality Rookie of the Year Justin Wise 1440x750px banner with "Quality Rookie of the Year" logo inset

    Meet the 2024 Quality Rookie of the Year: Justin Wise

    Justin Wise is an exceptional individual who has been...
    Aerospace
    By: Michelle Bangert
  • Man with umbrella and coat stands outside while it rains at night looking at a building.

    Nondestructive Testing: Is there an ethics problem?

    I was a whistleblower who exposed fraudulent activities...
    NDT
    By: Dale Norwood
  • Unraveling Deflategate: Football stadium with closeup of football on field

    Unraveling the Tom Brady Deflategate

    The Deflategate scandal erupted following the 2014 AFC...
    Measurement
    By: Greg Cenker and Henry Zumbrun
Manage My Account
  • eMagazine Subscriptions
  • Newsletters
  • Online Registration
  • Subscription Customer Service
  • Manage My Preferences

More Videos

Sponsored Content

Sponsored Content is a special paid section where industry companies provide high quality, objective, non-commercial content around topics of interest to the Quality audience. All Sponsored Content is supplied by the advertising company and any opinions expressed in this article are those of the author and not necessarily reflect the views of Quality or its parent company, BNP Media. Interested in participating in our Sponsored Content section? Contact your local rep!

close
  • Key Takeaways for Quality Leaders
    Sponsored byComplianceQuest

    Key Takeaways for Quality Leaders from the 2026 Gartner Magic Quadrant™ for QMS

  • This image shows a person seated next to a Bobcat T66 compact track loader.
    Sponsored byPolyWorks by InnovMetric

    Supercharging Digital Gauging at Bobcat North America

  • Dorsey Calibration Lab photo by Tom LaBarbera Picture this Studios
    Sponsored byDorsey Metrology International

    Ensuring Product Quality in a Competitive Manufacturing Landscape

Popular Stories

a titanium diaphragm speaker driver

The One Thing Elon Gets Right Is Designed to Scare You

This image shows a person seated next to a Bobcat T66 compact track loader.

Supercharging Digital Gauging at Bobcat North America

Dorsey Calibration Lab photo by Tom LaBarbera Picture this Studios

Ensuring Product Quality in a Competitive Manufacturing Landscape

2026 Quality Professional of the Year!

Events

June 9, 2026

Future-Proof your Quality Processes with Advanced 3D Optical CMM Technology

Discover how to effortlessly capture complex data, leverage true multi-sensor automation, and ensure continuous operation without creating inspection delays.

June 22, 2026

Automate 2026

Automate is North America's largest robotics and automation event — and the best place to take your ideas from insight to impact.
 
Our show floor features the world’s leading automation solutions, from AI and robotics to motion control, vision systems, and more. Plus, our educational conference is second to none, led by the brightest minds in automation today.
 
Ready to transform the way you work? Take the next step at Automate.
View All Submit An Event

Products

Lean Manufacturing and Service Fundamentals, Applications, and Case Studies

Lean Manufacturing and Service Fundamentals, Applications, and Case Studies

See More Products
Quality Podcast Channel Custom Content

Related Articles

  • Brain Teasers: Is the Customer Always Right?

    See More
  • Brain Teasers: What Size Is It?

    See More
  • Brain Teasers: Failing Too Fast

    See More

Related Products

See More Products
  • Quality Brain Teasers: Real World Challenges to Build Your Manufacturing Skills (ebook)

  • What Is BPM?

See More Products

Related Directories

  • ETQ, part of Hexagon

    ETQ, part of Hexagon, is a leading provider of integrated quality management, health, safety, and environmental solutions for manufacturers. Firms around the world rely on ETQ to ensure optimal quality at scale, reduce costs and improve the velocity of data-driven decisions. Learn more at etq.com.
×

Stay in the know with Quality’s comprehensive coverage of
the manufacturing and metrology industries.

Newsletters | Website | eMagazine

JOIN TODAY!
  • RESOURCES
    • Advertise
    • Contact Us
    • Directories
    • Manufacturing Division
    • Store
    • Want More
  • SIGN UP TODAY
    • Create Account
    • eMagazine
    • Newsletters
    • Customer Service
    • Manage Preferences
  • SERVICES
    • Marketing Services
    • Market Research
    • Reprints
    • List Rental
    • Survey/Respondent Access
  • STAY CONNECTED
    • LinkedIn
    • Facebook
    • YouTube
    • X (Twitter)
  • PRIVACY
    • PRIVACY POLICY
    • TERMS & CONDITIONS
    • DO NOT SELL MY PERSONAL INFORMATION
    • PRIVACY REQUEST
    • ACCESSIBILITY

Copyright ©2026. All Rights Reserved BNP Media, Inc. and BNP Media II, LLC.

Design, CMS, Hosting & Web Development :: ePublishing