Brain Teasers: Is the Customer Always Right?
Darlene is the marketing director for a company that makes vision inspection equipment. One customer makes disks that are soft and subject to distortion with mechanical inspection of the disk diameter. This customer has complained that the visual inspection equipment is not performing as well as it did in the past.
Anyone who has faced a production problem with a need to solve it by using production data can relate to the notion of a brain teaser. The brain teasers presented here are based on real-world situations encountered by workers in manufacturing environments. The brain teasers have three parts: (1) the situation, (2) available data or other supporting information, and (3) questions that various workers need answered for continual improvement. Recommended solutions follow in the next issue and on the Web at Quality Online (www.qualitymag.com).
Darlene’s review of production data reveals that there is no change in the diameters of the reference test units prior to shipment. No other customer has voiced this type of complaint, so the design and process engineers suspect that the cause of incorrect values is something in the customer’s location that negatively impacts the measurements. She has requested that two process engineers visit the customer’s site and evaluate the equipment’s performance using the same test reference units used with production of the inspection equipment.
2. Does the visual inspection equipment at the customer’s location perform predictably for the diameter of the test units?
3. Are the average and variation for diameter the same for the customer’s visual inspection unit as for the production units at Darlene’s company that have not yet been shipped?
4. If the process engineers find that the cause of any errors come from the customer’s use of the inspection equipment, how should they communicate that information to the customer?
 Q: What are the critical messages that the management of Plant 49 needs to convey clearly and effectively to Carlos using these two weeks of production data?
A: First, has each process (Lines 1, 2 and 3) been predictable or unpredictable for yield during these two weeks? If so, what is the capability of each predictable process? Second, if any of the processes were unpredictable, what were the circumstances and the identified exception along with the cause and the actions taken to eliminate the cause? Finally, what can Carlos expect from these three production lines going forward?
 Q: Prepare a graphical summary that can be annotated with notes to communicate these messages.
A: See the answer to the next question.
 Q: What graphs will be used? How can these graphs be enhanced with numerical summaries?
A: To communicate the predictability- or lack thereof-for each process make a process behavior chart. For each predictable process, make a histogram to support the capability calculations. Highlight the process average and natural process limits plus the capability indexes if specifications are known.
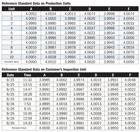
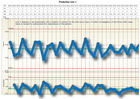
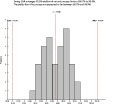
A graphical summary for Line 1 is shown in the graphs, “Production Line 1” and “Shift Details for Production Line 1,” for the day and graveyard shifts. The graph for the swing shift can be found online at www.qualitymag.com.
 Q: What questions might Carlos have for the plant management team? Which of these can be answered using the proposed graphical summaries?
A: Carlos’ questions should include: Do all production lines have predictable process behavior? Is the predictable behavior good enough for running the production economically? If the processes are unpredictable, what are the causes of the exceptional behavior and what actions have been taken to eliminate the causes? Is the overall behavior of each process hiding messages about each shift? If so, how do the individual shifts behave?
See the summaries for Production Lines 2 and 3 on the Quality Magazine Web site, www.qualitymag.com.
Anyone who has faced a production problem with a need to solve it by using production data can relate to the notion of a brain teaser. The brain teasers presented here are based on real-world situations encountered by workers in manufacturing environments. The brain teasers have three parts: (1) the situation, (2) available data or other supporting information, and (3) questions that various workers need answered for continual improvement. Recommended solutions follow in the next issue and on the Web at Quality Online (www.qualitymag.com).
Situation
Darlene is the marketing director for a company that makes vision inspection equipment used in a variety of industrial applications. One customer makes disks that are soft and subject to distortion with mechanical inspection of the disk diameter. This customer has complained that the visual inspection equipment is not performing as well as it did in the past. In particular, there are errors in some of the values for the diameter of the unit in question.Darlene’s review of production data reveals that there is no change in the diameters of the reference test units prior to shipment. No other customer has voiced this type of complaint, so the design and process engineers suspect that the cause of incorrect values is something in the customer’s location that negatively impacts the measurements. She has requested that two process engineers visit the customer’s site and evaluate the equipment’s performance using the same test reference units used with production of the inspection equipment.
Available data
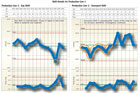
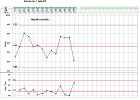
The process engineers gathered data on the performance of the visual inspection unit over a two-day period at the customer’s site. They compared the results to data collected in their manufacturing facility prior to shipping. The test units used for data collection in both places were six reference standards that are used regularly. Test data appear in the two tables, “Reference Standard Data on Production Units” and “Reference Standard Data on Customer’s Inspection Unit.” The value of each reference standard is given at the bottom of both tables.Questions
1. How can these data be analyzed to determine if there are errors in the equipment at the customer’s location?2. Does the visual inspection equipment at the customer’s location perform predictably for the diameter of the test units?
3. Are the average and variation for diameter the same for the customer’s visual inspection unit as for the production units at Darlene’s company that have not yet been shipped?
4. If the process engineers find that the cause of any errors come from the customer’s use of the inspection equipment, how should they communicate that information to the customer?
Answers to October Brain Teaser
Now that Carlos has moved from being an engineering manager for a glass manufacturer to division manager of specialty glass, he is overwhelmed with reports that have pages of data. He prefers graphical summaries accompanied by numerical summaries relevant to the situation and has requested that all reports prepared for him follow this format so he can digest the information quickly. This change in format is confusing to some who make the reports, particularly management at Plant 49.A: First, has each process (Lines 1, 2 and 3) been predictable or unpredictable for yield during these two weeks? If so, what is the capability of each predictable process? Second, if any of the processes were unpredictable, what were the circumstances and the identified exception along with the cause and the actions taken to eliminate the cause? Finally, what can Carlos expect from these three production lines going forward?
A: See the answer to the next question.
A: To communicate the predictability- or lack thereof-for each process make a process behavior chart. For each predictable process, make a histogram to support the capability calculations. Highlight the process average and natural process limits plus the capability indexes if specifications are known.
A graphical summary for Line 1 is shown in the graphs, “Production Line 1” and “Shift Details for Production Line 1,” for the day and graveyard shifts. The graph for the swing shift can be found online at www.qualitymag.com.
A: Carlos’ questions should include: Do all production lines have predictable process behavior? Is the predictable behavior good enough for running the production economically? If the processes are unpredictable, what are the causes of the exceptional behavior and what actions have been taken to eliminate the causes? Is the overall behavior of each process hiding messages about each shift? If so, how do the individual shifts behave?
See the summaries for Production Lines 2 and 3 on the Quality Magazine Web site, www.qualitymag.com.
Looking for a reprint of this article?
From high-res PDFs to custom plaques, order your copy today!


