But is it Bonded?
Many products have internal bonded interfaces between materials and the problem for assemblers is determining whether the materials are truly bonded over an adequate area.
 The defects that attack bonds may be called disbonds (never bonded), delaminations (bonded, then broken loose), voids (air bubbles), cracks or some other term, but they all can be reliability killers.
The reason for wanting to find these gap-type defects is often to preserve strength, structural integrity and, in some cases, thermal conductivity. Suppose a product includes a polymer layer bonded to a metal layer. Because a polymer is very transparent to X-ray, disbonds and other gaps will be hard to see. If both layers are metal, a gap might be visible in the X-ray image, especially if the gap is thick relative to the whole thickness of the part. If the part is, say, 1-cm thick and between two metal layers and there is a void gap only 10 microns thick, the “missing material” represented by the void is too insignificant to create contrast in the X-ray image. Alternately, engineers could cut through the part and polish the exposed surface, but if the gap is small enough it may be filled-in and obscured by the polishing process. And the cutting process destroys the part.
There are many instances in which the same part can be imaged by either X-ray or acoustic microscopy, especially where the suspected defect is not extremely thin. X-ray and acoustic microscopy are thus said to be complementary methods.
Acoustic inspection of materials takes three general forms, depending on the frequency of ultrasound being used. Ultrasonic testing uses a probe to create an echo that is interpreted and uses fairly low ultrasonic frequencies. Ultrasonic imaging (such as medical ultrasound) uses somewhat higher frequencies, up to perhaps 20 MHz and converts echoes into pixels to make a visible image. Acoustic microscopes use higher-frequency ultrasound from 15 up to 400 MHz and above to produce high-resolution acoustic images.
An acoustic microscope system uses a focused transducer that raster-scans the top surface of the part at speeds up to 40 inches per second. Frequencies up to 300 MHz are designated as Very High Frequency; those above 300 MHz are Ultra High Frequency. As the transducer moves across the part, it sends a few thousand sequential pulses of ultrasound per second into the part.
The ultrasound that an acoustic microscope pulses into the sample is reflected from material interfaces, but it is reflected with maximum amplitude from gaps-cracks, disbonds and the like. A few microseconds later, the return echoes from material interfaces at various depths within the part arrive back at the transducer, the exact arrival time depending on the depth of the interface from which the pulse was reflected.
Where a polymer layer is bonded to a metal layer, the percent of pulse energy reflected by the interface can be calculated by knowing the properties of the two materials-the percentage may be 15, 35 or 60, for example. Some of the energy will travel deeper and may be reflected by a deeper material interface.
If part of the area where the polymer should be bonded to the metal is disbanded, delaminated or contains a void or crack, then the interface that the pulse hits will be polymer-to-air instead of polymer-to-metal. The properties of a gas such as air are so different from the properties of a solid that 99.99% of the pulse will be reflected.
In the acoustic image, the bonded polymer-to-metal areas will be some shade of gray, but the defect will be bright white, indicating the highest reflection amplitude. It is the solid-to-air interface that does the reflecting. Within limits, the thickness of the gap is unimportant; at the frequencies used in acoustic microscopy, a gap 1-mm thick will have the same brightness as a gap <1-µ thick.
Samples imaged by acoustic microscopes are usually relatively thin-perhaps up to a few cm in thickness, depending on the frequency of ultrasound used. Lower frequencies (15 MHz, for example) penetrate farther but have less resolution in the image; higher frequencies (100 up to 400 MHz) penetrate less but have greater resolution.
Most samples have one flat surface that is scanned by the transducer, but cylindrical, spherical and even conical samples can be imaged.
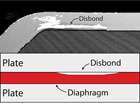
Figure 1 is the acoustic image of the interface between two metal pieces holding a flexible diaphragm in place. The purpose of acoustic imaging was to determine whether the seal at the edges of the diaphragm was good. The diaphragm, at bottom, appears somewhat wavy because it produces an interference pattern. The ultrasonic pulse has traveled through the bulk of the top metal piece, and echoes are reflected from the metal-diaphragm interface.
Where the two plates are well-bonded to the edge of the diaphragm, the interface are light gray. The irregular white areas are disbonds. A few small scattered disbonds might not be critical, but these disbonds come close to forming a continuous pathway from the diaphragm to the exterior. Vibration, thermal cycling or other factors could cause a leak, which would result in a performance failure. This disbonded area is a good example of a defect that would be very difficult to detect by other methods. The acoustic image shows the extent of the disbond and may give clues about the processing error that caused the disbond.
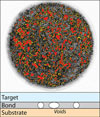
An X-ray target is shown in Figure 2. In an X-ray system, the target is a dense metal element mounted at a 45° angle to the electron beam coming from the anode. Some of the electron beam is converted into X-rays, which are redirected by the angled target toward the subject. The rest of the beam is converted into heat. In this image, the red areas are the areas of highest amplitude reflection and indicate voids in the bond between the target and its substrate. Yellow areas are the edges of voids and have slightly lower amplitude.
The voids between the target and the substrate are not large, but they are very numerous. Altogether they cover 27% of the contact area. Because most of the electron beam that strikes the target is converted into heat, this is an unacceptably high void percentage.
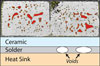
Figure 3 is the acoustic image of the solder layer bonding a copper heat sink to two rectangular ceramic plates. The transducer scanned the surface of the heat sink. Ultrasound was reflected from the solder depth and from multiple lower interfaces in the structure, but by “gating” on a narrow time-of-arrival echo window, only the echoes from the solder depth were used to make this image.
The red areas in the image are voids-basically, air bubbles that were trapped in the molten solder during assembly. The voids probably are not very important in keeping the heat sink permanently bonded to the ceramic plates, but they may be very important as heat reflectors. The heat sink is intended to dissipate heat from high-power integrated circuits below the ceramic plates. The numerous voids not only block heat from escaping, they reflect it back toward the integrated circuits. The ceramic plate at left has a void area of 9.20%, worrisome in this type of device, known as an IGBT (Insulated Gate Bipolar Transistor).
These voids would probably be visible to X-ray, because they are relatively thick. The contrast, though, would not be as high as in the acoustic image. But what would happen if the voids were present and the entire plate was also disbonded by a thin gap from the substrate? X-ray would see the voids, but not the thin gap. Ultrasound would see the voids and the gap-the entire area of the plate would be red.
Most production materials such as metals, ceramics and polymers transmit high-frequency ultrasound well enough to permit imaging. A few materials are generally not good subjects for acoustic imaging, including wood (too porous) and rubber (if too thick, absorbs ultrasound).
Acoustic imaging is sometimes used before other methods, including physical sectioning. The advantage is that the acoustic image shows exactly where to position the vertical plane in order to see the desired details. An acoustic microscope can also perform non-destructive cross-sections that will show the same features as physical cross-sectioning. Even after multiple acoustic cross-sections, the sample is still physically intact. And the acoustic method gives a very comprehensive answer to the question, “Is it bonded?” NDT
Acoustic microscopes use higher-frequency ultrasound from 15 up to 400 MHz and above.
At the frequencies used in acoustic microscopy, a gap 1-mm thick will have the same brightness as a gap <1-µ thick.
Voids (red in the acoustic image) compromise the bond of an X-ray target to its substrate. Source: Sonoscan
Acoustic image and side-view diagram of diaphragm held between two bar. White areas in the acoustic image show where metal bars are not bonded to the edge of the diaphragm. Source: Sonoscan
The reason for wanting to find these gap-type defects is often to preserve strength, structural integrity and, in some cases, thermal conductivity. Suppose a product includes a polymer layer bonded to a metal layer. Because a polymer is very transparent to X-ray, disbonds and other gaps will be hard to see. If both layers are metal, a gap might be visible in the X-ray image, especially if the gap is thick relative to the whole thickness of the part. If the part is, say, 1-cm thick and between two metal layers and there is a void gap only 10 microns thick, the “missing material” represented by the void is too insignificant to create contrast in the X-ray image. Alternately, engineers could cut through the part and polish the exposed surface, but if the gap is small enough it may be filled-in and obscured by the polishing process. And the cutting process destroys the part.
There are many instances in which the same part can be imaged by either X-ray or acoustic microscopy, especially where the suspected defect is not extremely thin. X-ray and acoustic microscopy are thus said to be complementary methods.
Acoustic inspection of materials takes three general forms, depending on the frequency of ultrasound being used. Ultrasonic testing uses a probe to create an echo that is interpreted and uses fairly low ultrasonic frequencies. Ultrasonic imaging (such as medical ultrasound) uses somewhat higher frequencies, up to perhaps 20 MHz and converts echoes into pixels to make a visible image. Acoustic microscopes use higher-frequency ultrasound from 15 up to 400 MHz and above to produce high-resolution acoustic images.
An acoustic microscope system uses a focused transducer that raster-scans the top surface of the part at speeds up to 40 inches per second. Frequencies up to 300 MHz are designated as Very High Frequency; those above 300 MHz are Ultra High Frequency. As the transducer moves across the part, it sends a few thousand sequential pulses of ultrasound per second into the part.
The ultrasound that an acoustic microscope pulses into the sample is reflected from material interfaces, but it is reflected with maximum amplitude from gaps-cracks, disbonds and the like. A few microseconds later, the return echoes from material interfaces at various depths within the part arrive back at the transducer, the exact arrival time depending on the depth of the interface from which the pulse was reflected.
Where a polymer layer is bonded to a metal layer, the percent of pulse energy reflected by the interface can be calculated by knowing the properties of the two materials-the percentage may be 15, 35 or 60, for example. Some of the energy will travel deeper and may be reflected by a deeper material interface.
If part of the area where the polymer should be bonded to the metal is disbanded, delaminated or contains a void or crack, then the interface that the pulse hits will be polymer-to-air instead of polymer-to-metal. The properties of a gas such as air are so different from the properties of a solid that 99.99% of the pulse will be reflected.
In the acoustic image, the bonded polymer-to-metal areas will be some shade of gray, but the defect will be bright white, indicating the highest reflection amplitude. It is the solid-to-air interface that does the reflecting. Within limits, the thickness of the gap is unimportant; at the frequencies used in acoustic microscopy, a gap 1-mm thick will have the same brightness as a gap <1-µ thick.
Samples imaged by acoustic microscopes are usually relatively thin-perhaps up to a few cm in thickness, depending on the frequency of ultrasound used. Lower frequencies (15 MHz, for example) penetrate farther but have less resolution in the image; higher frequencies (100 up to 400 MHz) penetrate less but have greater resolution.
Most samples have one flat surface that is scanned by the transducer, but cylindrical, spherical and even conical samples can be imaged.
Figure 1 is the acoustic image of the interface between two metal pieces holding a flexible diaphragm in place. The purpose of acoustic imaging was to determine whether the seal at the edges of the diaphragm was good. The diaphragm, at bottom, appears somewhat wavy because it produces an interference pattern. The ultrasonic pulse has traveled through the bulk of the top metal piece, and echoes are reflected from the metal-diaphragm interface.
Where the two plates are well-bonded to the edge of the diaphragm, the interface are light gray. The irregular white areas are disbonds. A few small scattered disbonds might not be critical, but these disbonds come close to forming a continuous pathway from the diaphragm to the exterior. Vibration, thermal cycling or other factors could cause a leak, which would result in a performance failure. This disbonded area is a good example of a defect that would be very difficult to detect by other methods. The acoustic image shows the extent of the disbond and may give clues about the processing error that caused the disbond.
An X-ray target is shown in Figure 2. In an X-ray system, the target is a dense metal element mounted at a 45° angle to the electron beam coming from the anode. Some of the electron beam is converted into X-rays, which are redirected by the angled target toward the subject. The rest of the beam is converted into heat. In this image, the red areas are the areas of highest amplitude reflection and indicate voids in the bond between the target and its substrate. Yellow areas are the edges of voids and have slightly lower amplitude.
The voids between the target and the substrate are not large, but they are very numerous. Altogether they cover 27% of the contact area. Because most of the electron beam that strikes the target is converted into heat, this is an unacceptably high void percentage.
Figure 3 is the acoustic image of the solder layer bonding a copper heat sink to two rectangular ceramic plates. The transducer scanned the surface of the heat sink. Ultrasound was reflected from the solder depth and from multiple lower interfaces in the structure, but by “gating” on a narrow time-of-arrival echo window, only the echoes from the solder depth were used to make this image.
The red areas in the image are voids-basically, air bubbles that were trapped in the molten solder during assembly. The voids probably are not very important in keeping the heat sink permanently bonded to the ceramic plates, but they may be very important as heat reflectors. The heat sink is intended to dissipate heat from high-power integrated circuits below the ceramic plates. The numerous voids not only block heat from escaping, they reflect it back toward the integrated circuits. The ceramic plate at left has a void area of 9.20%, worrisome in this type of device, known as an IGBT (Insulated Gate Bipolar Transistor).
These voids would probably be visible to X-ray, because they are relatively thick. The contrast, though, would not be as high as in the acoustic image. But what would happen if the voids were present and the entire plate was also disbonded by a thin gap from the substrate? X-ray would see the voids, but not the thin gap. Ultrasound would see the voids and the gap-the entire area of the plate would be red.
Most production materials such as metals, ceramics and polymers transmit high-frequency ultrasound well enough to permit imaging. A few materials are generally not good subjects for acoustic imaging, including wood (too porous) and rubber (if too thick, absorbs ultrasound).
Acoustic imaging is sometimes used before other methods, including physical sectioning. The advantage is that the acoustic image shows exactly where to position the vertical plane in order to see the desired details. An acoustic microscope can also perform non-destructive cross-sections that will show the same features as physical cross-sectioning. Even after multiple acoustic cross-sections, the sample is still physically intact. And the acoustic method gives a very comprehensive answer to the question, “Is it bonded?” NDT
Red areas are heat-blocking voids between a heat sink and two ceramic plates. Source: Sonoscan
Tech Tips
A 10-micron thick void is too insignificant to create contrast in the X-ray image.Acoustic microscopes use higher-frequency ultrasound from 15 up to 400 MHz and above.
At the frequencies used in acoustic microscopy, a gap 1-mm thick will have the same brightness as a gap <1-µ thick.
Looking for a reprint of this article?
From high-res PDFs to custom plaques, order your copy today!


