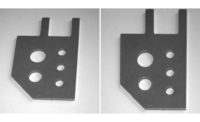
What is image analysis? The term is widely used over a variety of technology disciplines, and has varying meanings. To define image analysis within machine vision, take a moment first to consider the broad scope of the typical industrial inspection or guidance application. Digital cameras or other complex sensors are integrated with lenses or specialized optics along with dedicated light sources to capture a picture or representation of an object. By various means, the picture might be manipulated to enhance and optimize the content. Specialized software tools are used to extract information from features in the picture. Ultimately, that information is provided to the automated process for tasks like guidance, measurement, or quality assurance.
These important steps within a successful machine vision application can be grouped into general operational categories. The terms image acquisition, image processing, image analysis, and results processing often are used to describe the four actions mentioned above. (Although the terminology certainly makes sense for machine vision, bear in mind that these designations are only loosely used, and can take on different meanings depending on context.) In this tutorial we will focus on image analysis, and will cover just a few of the very basic concepts of this broad and important part of machine vision technology and software.
For our purposes then, image analysis is the part of machine vision where the bulk of the actual “work” takes place. In short, image analysis is where data and information required by the application and the automation system are extracted from an image. Getting the right information, repeatably and reliably, requires competent specification and application of one or perhaps many inspection algorithms. To help with that, one should first understand a couple of the ways content is extracted from an image.
Extracting image content
Fundamentally, an image used for general purpose machine vision contains thousands of data points that we more commonly call “pixels.” For most image acquisitions, these data points contain a value representing the amount of light that has been captured by the pixel (called the “grayscale” value of the pixel). A pixel also has a location relative to its position on the sensor. In some cases, like when the image represents a 3-D cloud of points, the pixel location might be represented as a point in real world space with X, Y, Z coordinates. For this introductory discussion though, we will only cover analysis for 2-D, grayscale information.
In the analysis of an image, machine vision software performs operations on the pixel data using both location and the grayscale value of a pixel or, most often, groups of neighboring pixels. To help differentiate the basic function of these operations, we can classify many as using either native grayscale information, or using gradient information that is derived directly from the grayscale information. In machine vision image analysis, gradient in its most simple context means the changes in grayscale observed between neighboring pixels. Another term often used for image gradients is edges. In fact, it is not uncommon to have the root process of a machine vision tool (or “algorithm”) described as “grayscale-based” or “edge-based.” Let’s briefly look into how this works and how it might impact our selection and application of a tool for image analysis.
Pixels and edges
The grayscale value of a pixel represents the amount of light stored by that pixel when the image is captured. Many external factors affect this value including light intensity and color, object reflectivity, optics, camera exposure time, and others. On a plant floor, influencers like ambient light, part presentation, and part variation can also impact the grayscale image content. These changes in the image content might result in incorrect analysis. Proper application of lighting, optics, cameras and components for image acquisition can help to ensure consistent response, and pre-processing also is useful in ensuring image grayscale repeatability when using any machine vision tool, and particularly grayscale-based tools.
Image analysis tools can use native grayscale data count and/or group pixels within constrained ranges of grayscale values; or specific “colors.” Such tools can, for example, extract features within an image and provide information about the location, size and shape of the feature, or report the general color of image within specific regions.
Edge-based tools perform processing on localized changes in the color of neighboring pixels. These gradients are mathematically calculated in a variety of ways depending upon the algorithm. Whether the change in color is subtle or intense, the gradient usually can be calculated. The importance of this capability is that as a scene changes in brightness and/or contrast, a process can still extract edge data as long as there is a sufficient gradient, or change of color, across the targeted neighboring pixels.
Image analysis tools that use edges to get information from an image can make use of the intensity of the edge as well as the position and perhaps the direction of edge points and groups of edges points. Typical image analysis operations using edges include measurements between edges of a target feature or the location of edges or groups of edges to determine feature position and geometry.
Understanding these basics of image content as used by many machine vision tools for image analysis aids us in the selection and implementation of those tools for a specific application. For example, images with features or defects that are well defined with consistent color might respond well to tools that process grayscale information while edge-based tools might be used to overcome image variations. Let’s consider some typical machine vision tools, and their uses in practical applications.
Typical image analysis tools and practical applications
General purpose components for machine vision, such as smart cameras and PC-based systems, offer a broad range of tools for image analysis. Sometimes these involve complex combinations of algorithms that effectively extract information for a specific type of process. In many cases, though, the job only requires the prudent application of just a few simpler tools. Here we’ll briefly introduce four of those tools and their implementation in image analysis.
One very basic tool provides the capability to analyze grayscale pixel content in the image or region of an image statistically. These “histogram analysis” tools simply count the number of pixels found at each gray level. The counts themselves can be useful in determining the content of an image. Knowing, for example, the average color of a feature, and the typical number of pixels covering the feature, a test of the number of pixels in the appropriate color range can verify the presence/absence and perhaps even the size of the target feature. The algorithm often provides other extensive statistical information about the grayscale data as well. The process time for this type of tool is very quick, and these tools are frequently used for things like part presence and defect detection.
Another powerful grayscale image analysis tool is “connectivity” also known as “blob analysis” or in some implementations “particle analysis.” Again working with pixel colors, the connectivity tool groups neighboring pixels of similar colors into connected forms. It does so usually by first separating the colors of the pixels into two states—light or dark—based upon a dividing “threshold” (the resulting pixel representation is called a “binary” image). The tool provides information about the connected blobs, including size, shape, location, and much more. As with the histogram tool, blob analysis is a very fast process. It is used for part presence/absence and differentiation, location and guidance, defect detection and more.
A basic edge-based process is that of the measurement of a pair of edges or the location of a single edge in an area of the image. Tools that perform this function might be called “calipers” or “edge pairs.” The feature of this type of algorithm is that it returns a very accurate and repeatable point (or line or possibly circle) at the edge of a feature in the image over a very broad range of image brightness and contrast variation. This type of tool is used for measurement, or can be instrumental in part differentiation or presence/absence.
A vastly more complex tool using (fundamentally) edge information is the “geometric search” or “pattern match.” This type of tool uses a pre-trained model where edges (and other content) are mathematically extracted to form a data representation of the target object. Since the model is strictly data, it can be mathematically re-sized, rotated, skewed, or manipulated as needed for the application, or even created from scratch without an image. A search algorithm then uses the trained model to find matching instances of the model in the image being processed. As with most edge-based tools, a geometric search works well over varying image conditions, and in many cases can even find a model in significantly degraded images. A geometric search is critical to many applications involving precision location and guidance, and can be used also for a variety of other processing like part presence/absence and feature/object differentiation.
What’s Next
This tutorial has only introduced some of the basic topics in the broad range of machine vision image analysis. As a starting point, it is important to understand these fundamentals as you consider how to best implement a machine vision application, and even more important to take the next steps to learn more about how the technology can benefit many automation applications.


