Stress-Life Fatigue Testing Basics
The many variables associated with material type, sample geometry and in service use of a part or component complicates the design and implementation of an appropriate fatigue testing regime.
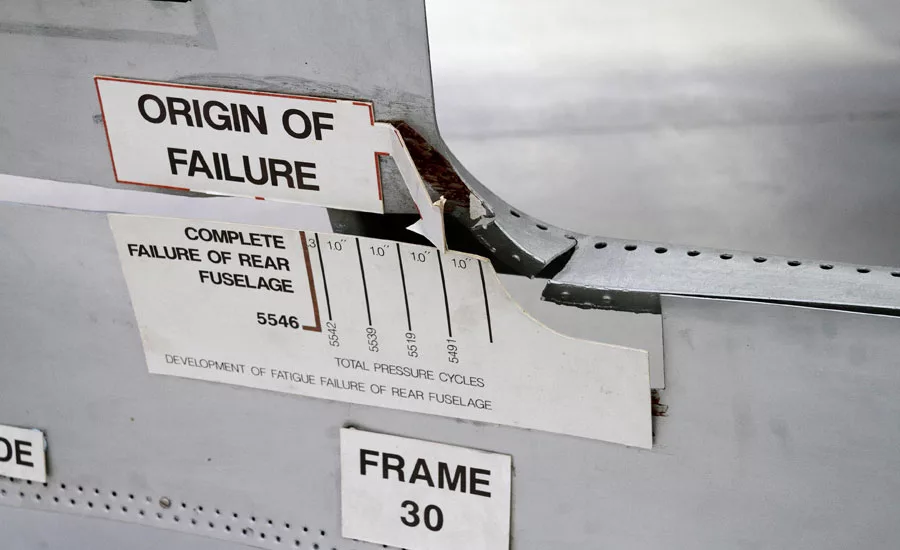
Figure 1 – The de Havilland DH 106 Comet was the world’s first commercial airliner and featured a pressurized cabin designed for transatlantic flights. In 1954, approximately a year and a half after entering service three Comets broke up mid-flight resulting in the loss of passenger and crew. Following the accidents, the forward fuselage was tested for metal fatigue by repeatedly pressurizing the cabin in a water tank. The pressurized cycle tests identified locations of high stress at the corners of the windows due to their square shape. In order to minimize the stress concentrations in these regions, the plane's designers made the windows more round or oval. (Maurice Savage / Alamy Stock Photo)
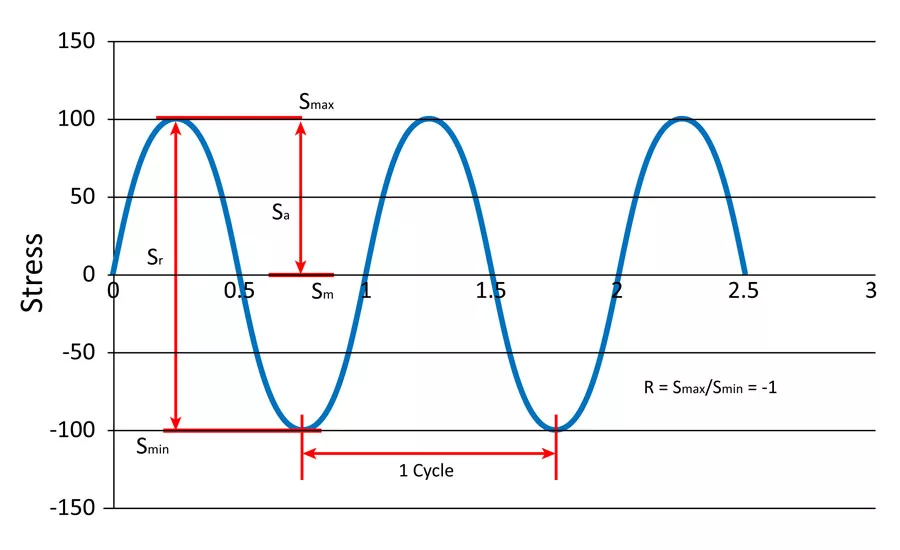
Figure 2 - Fully Reversed Stress Based Cycle
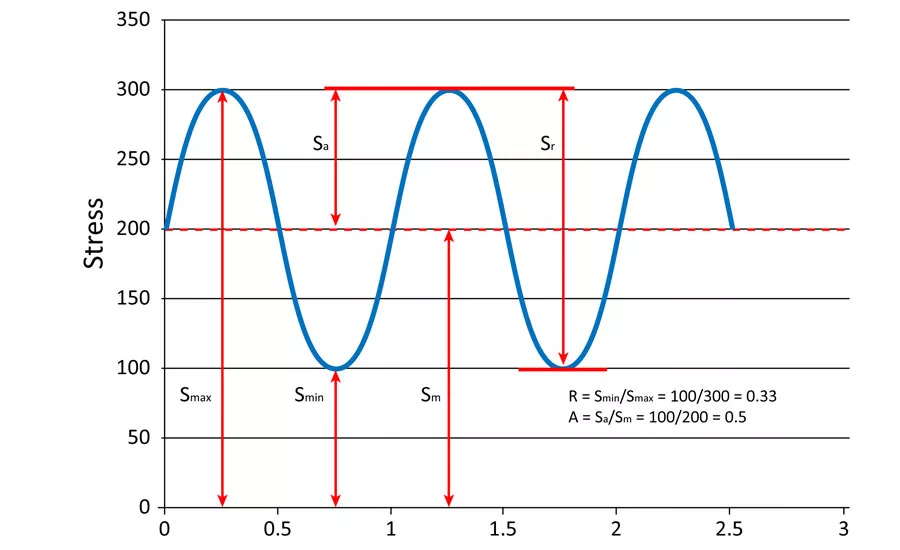
Figure 3 - Repeated Stress Cycle. Figure 3 depicts a repeated stress cycle in which the maximum stress and minimum stress are not equal in magnitude. Both stresses are in tension but they could also be in tension and compression or compression only.
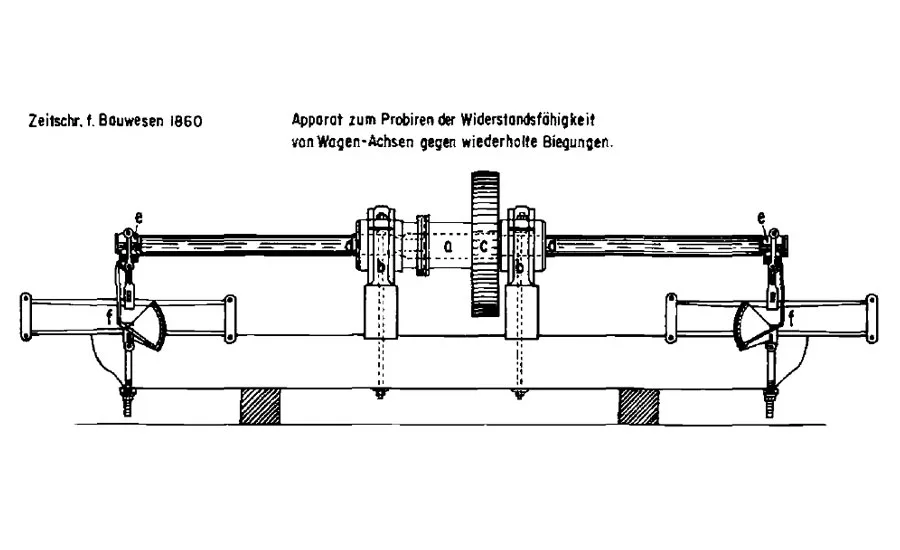
Figure 4 – Wohler’s Fatigue Testing Machine (2). A spindle (a) in the center of the machine is supported by two bearing blocks (b) and rotated at approximately 15 rpm. Two axles (test specimens) were mounted to both ends of the rotating spindle and bending forces were applied to the axles through a spring mechanism (f) located at both ends of the machine. During each revolution, both axles were subjected to a fully reversed bending stress. The magnitude of the bending stress was adjusted by the tension in the spring mechanism.
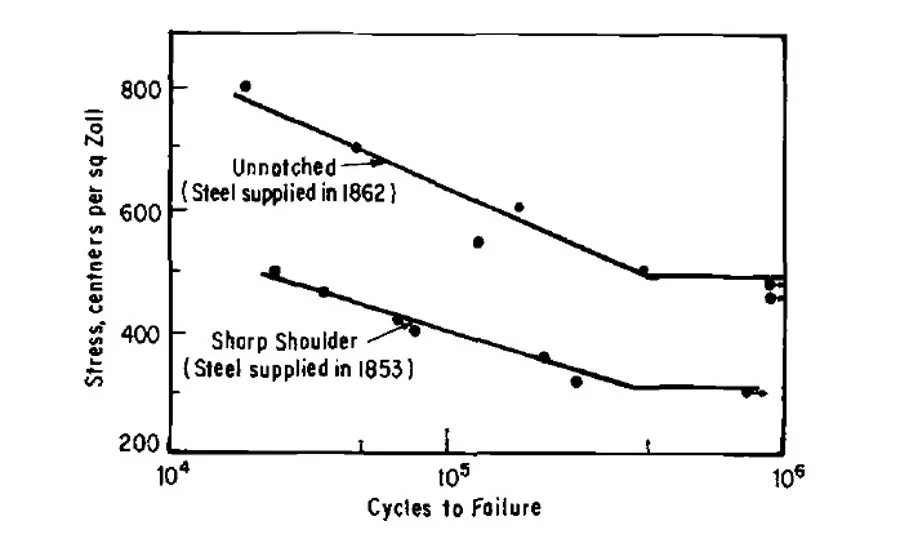
Figure 5 – Wohler’s S-N curves for Krupp axle steel (2).
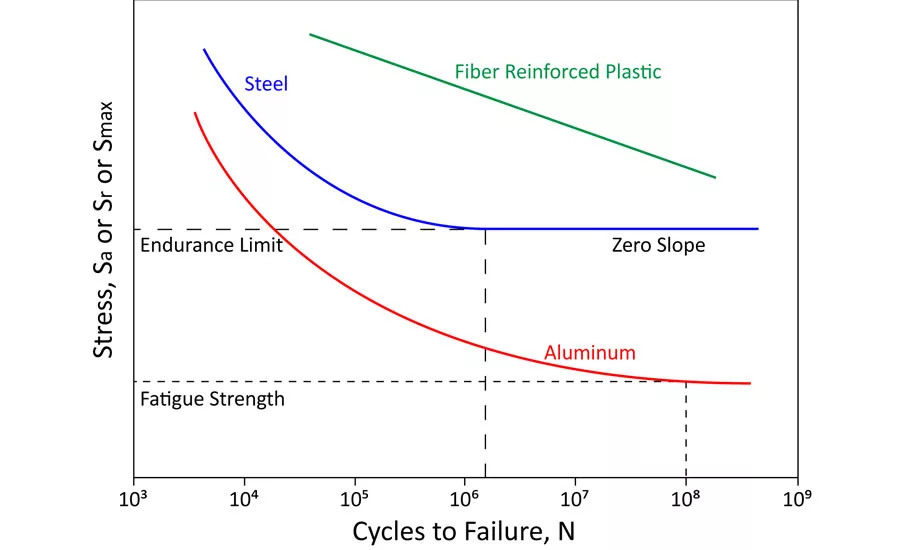
Figure 6 - S-N diagrams for steel, aluminum and fiber reinforced plastic.
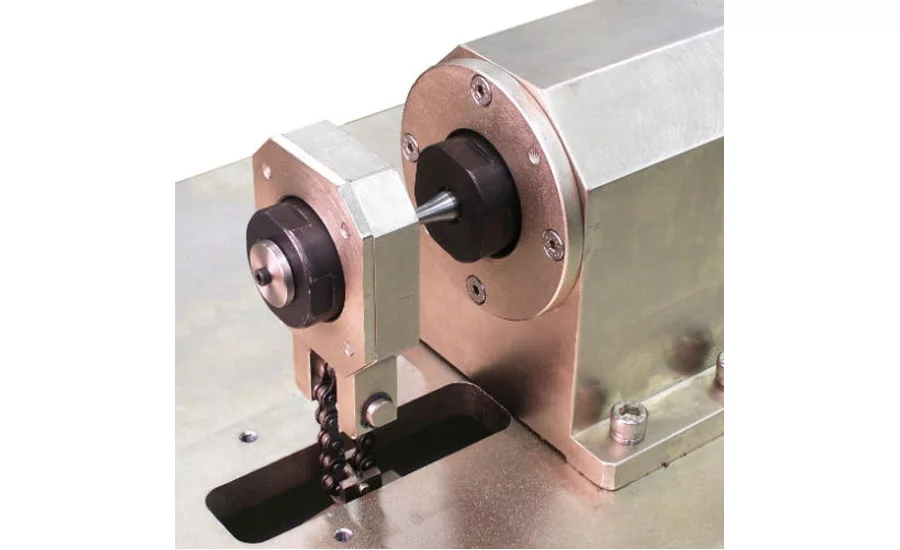
Figure 7- Ducom Instruments rotating bar bending fatigue testing machine. A test piece mounted as a cantilever with single point loading is made to rotate and thus subjected to a bending moment. Principle is similar to Wohler’s machine built in the 1800s. Courtesy of Ducom Instruments
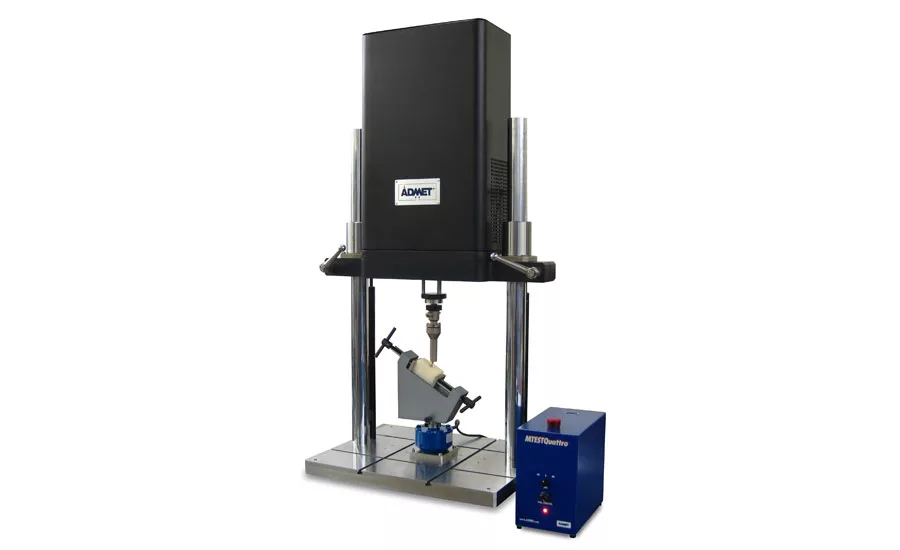
Figure 8 –This fatigue testing system is configured for testing dental implants according to ISO 14801 Dentistry Implants – Dynamic Fatigue Test for Endosseous Dental Implants. Source: ADMET
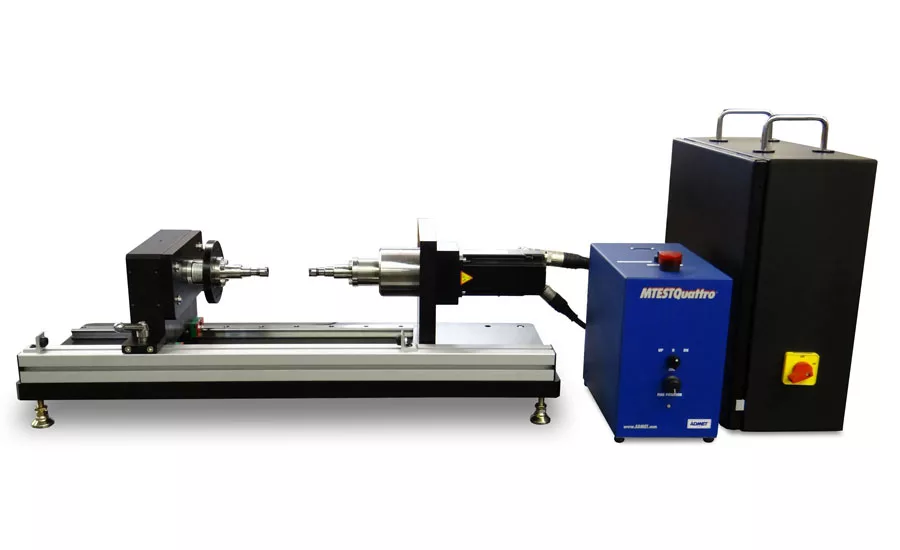
Figure 9 – A Torsion Fatigue Testing System configured for performing fatigue tests on small components used in portable electronic equipment Source: ADMET
Since 1850 we have known that metal subjected to fluctuating stresses will fail at a stress much lower than required to cause fracture on a single quasi static pull to break. Failure usually occurs without warning and results in a brittle appearing fracture with no significant deformation. Metal fatigue is a multi-step process and is often described as having four stages.
Stage 1: Crack Initiation: A part becomes damaged as a micro crack forms at a point of high stress concentration. High stress concentration points are usually located at notches, sharp edges or corners. Annealing is used to repair metals damaged in stage 1.
Stage 2: Slip Band or Stage 1 Crack Growth: The initial crack deepens on planes of high shear stress and becomes well defined.
Stage 3: Stage II Crack Growth: The well-defined crack grows in a direction normal to the maximum tensile stress.
Stage 4: Ductile Failure: When the crack reaches a critical length, the remaining cross section cannot support the applied forces and the part fails.
Cycle Testing
Fatigue tests are most frequently carried out under stress based constant amplitude loading. Test samples can be subjected to a variety of waveform geometries, however, sinusoids are most prevalent. Figure 2 depicts a stress based sinusoidal waveform showing fully reversed stress cycles. The maximum and minimum stresses are equal and opposite in a fully reversed cycle test. By convention compressive stresses are negative.
Most stress based fatigue testing is conducted using fully reversed loading. However, many examples exist where fully reversed loading is not performed either because it is not possible or during normal service a component is only subjected to forces in one direction. Examples of repeated stress cycle loading include compression only fatigue tests on hip implants and tension only tests on sheet steels (thin materials buckle in compression).
Waveform Properties
The following definitions and equations are used to express a stress based waveform. (Refer to Figures 2 and 3 for further explanation.)
Stress Range, Sr, - difference between the maximum and minimum stress.
Sr = Smax - Smin
where, Smax = Maximum Stress
Smin = Minimum Stress
Stress Amplitude, Sa - one half of the Stress Range, Sr.
Sa = Sr/2 = (Smax-Smin)/2
Mean Stress, Sm- average of the maximum and minimum stress.
Sm = (Smax + Smin)/2
Stress Ratio, R – equals -1 for fully reversed loading.
R = Smin/Smax
Amplitude Ratio, A – infinite for fully reversed loading.
A = Sa/Sm = (1-R) / (1+R)
Force Application
Most fatigue tests are conducted by applying fluctuating bending forces, axial forces or torsional forces to a specimen. The formulas for calculating stress for each mode of loading is as follows:
Bending Stress
The maximum bending stress occurs on the surface of the specimen where c is greatest.
Sbending = Mc/I
where, M = Moment (force x distance)
c = distance from neutral axis to a point
I = moment of inertia (formula based on shape of specimen, round = pR4/4)
Axial Push-Pull Stress
Saxial = P/A
where, P = Axial Force
A = cross sectional area of specimen.
Torsional Stress
The maximum torsional stress occurs on the surface of the specimen where r is greatest.
Storque = Tr/J
where, T = Torque (force x distance)
r = distance from center to a point
J = polar moment of inertia (formula based on shape of specimen, round=πR4/2)
Stress Life Testing
Between 1852 and 1870, the first systematic fatigue tests were carried out on specifically designed laboratory specimens by August Wohler, a German railway engineer. These tests enabled Wohler to relate his experimental results to the stresses in locomotive axles. In 1870, Wohler compiled a report of his experimental work which contained several conclusions known as Wohler’s laws.
Wohler’s Laws (1)
Materials can be induced to fail by many repetitions of stress, all of which are lower than the static strength.
Stress amplitudes (or stress range) are decisive for the destruction of the cohesion of the material.
The maximum stress is of influence only in so far as the higher it is, the lower are the stress amplitudes (or stress ranges) which lead to failure. This translates to increasing the mean stress decreases the number of cycles to failure.
Stress life testing is based on Wohler’s work and requires multiple constant amplitude fatigue tests on identical samples to generate an S-N or Wohler diagram. Figures 4 and 5 are diagrams of Wohler’s fatigue testing machine and the S-N diagrams for the steel used in the axels, respectively (2). Stress life testing is the most common type of fatigue testing and is designed to determine the safe or infinite life or fatigue strength of a material or component.
The S-N or Wohler Diagram
In stress based fatigue tests, multiple samples of identical size, shape and composition are subjected to different levels of stress amplitude, Sa, or stress range, Sr, and the number of cycles to failure, N, is measured for each. Various types of instruments and machines are used to apply cyclic loading and include rotating bend and cantilever bend machines (Figure 7), servo-hydraulic or servo-electric axial push-pull testing systems (Figure 8), and electric motor driven torsion fatigue testers (Figure 9). The resulting S-N data for each identical specimen is plotted on either a log-log or semi log graph. Regression is used to fit a curve through the points resulting in an S-N diagram as shown in Figure 6. Depending on the type of cyclic loading the ordinate (y-axis) will represent stress amplitude, Sa, stress range, Sr, or maximum stress, Smax.
The S-N diagram for some materials including steel and titanium transitions to a zero slope at a particular stress level. As shown in Figure 6, the point at which the slope transitions to zero is referred to as the endurance limit. Materials subjected to stresses below the endurance limit will never fail under cyclic loading. The portion of the curve with negative slope is defined as the finite life region and the horizontal or zero slope portion of the curve is the infinite life region.
Many non-ferrous alloys such as aluminum and copper and composites such as fiber reinforced plastic exhibit an S-N diagram with negative slope only. Negative slope S-N diagrams have no definite endurance limit (see the aluminum S-N diagram in Figure 6). Materials exhibiting S-N diagrams without a definite endurance limit, report fatigue strength as a stress below which failure will not be expected in less than a specified number of cycles. The fatigue strength or effective endurance limit for these materials is sometimes defined as the stress that causes failure at a specified number of cycles (i.e. 108).
Variability of Fatigue Data
Fatigue can be characterized as a random process which results in a scatter of the test data. This variability complicates the analysis of the data and its subsequent use in real-life applications. Statistical methods are employed to determine the most efficient use of a limited number of test specimens required to give a specified degree of confidence in the results. These methods are used to aid in the selection of discrete stress levels and number of tests to be performed at each stress level. Also important is whether the test data is for exploratory purposes, for research and development, for design or for reliability. For example, Table 1 of ASTM D3479 Standard Test Method for Tension-Tension Fatigue of Polymer Matrix Composites specifies a minimum number of samples as six for preliminary work, 12 for research and development, and 24 for design and reliability analysis. A review of Chapter 3, Planning S-N and Response Tests, STP-588 Manual on Statistical Planning and Analysis for Fatigue Experiments(3) is recommended for those conducting stress-life fatigue tests.
Waveform Cycle Frequency
A fatigue test specimen is subjected to over 10 million cycles (107) in order to determine its endurance limit or fatigue strength resulting in a single test lasting days and sometimes weeks. As a result, there is an impetus to apply the stress cycle at a high frequency in order to shorten the length of each test. Stress life testing of metals under axial loading is governed by ASTM E466 Standard Practice for Conducting Force Controlled Constant Amplitude Axial Fatigue Tests of Metallic Materials. ASTM E466 recommends frequencies between 0.01 Hz to 100 Hz (10-2 to 102). However, localized yielding which occurs as a crack propagates through the test piece can cause specimen heating. Metals are good thermal conductors and any energy converted to heat is easily dissipated. Thus, stress-life testing of metals is generally frequency independent. Plastics on the other hand are more likely to be locally heated by high rates of stress reversals due to their inability to dissipate heat. This coupled with their lower melting points can result in lower fatigue strengths at higher frequencies. In general, 5Hz is the recommended maximum frequency for testing plastics. Fiber reinforced matrix composites have tailored mechanical properties which are dependent on the direction of loading relative to the fibers embedded in the composite. The direction of loading relative to the fibers and amount of resin in the matrix are important parameters when considering test frequencies. Higher amounts of resin in the matrix produce greater hysteresis (ie. strains within the resin) resulting in a material more susceptible to heating at higher frequencies. Matrix composite test specifications generally limit the test frequency to 5Hz or less. Regardless of the material, at the start of any fatigue testing regime, temperature should be monitored to ensure it does not affect the results.
A Final Note
The many variables associated with material type, sample geometry and in service use of a part or component complicates the design and implementation of an appropriate fatigue testing regime. Like all fatigue tests, the results are suitable for application to design only when the specimen test conditions realistically simulate service conditions. This article presents the basics to stress life fatigue testing. For those new to fatigue testing and planning to conduct their own tests, the author recommends reviewing the ASTM test specifications and references listed here.
Strain life and fracture mechanics crack growth testing are two alternative types of fatigue tests in wide use today. Each of the three methods are employed for different design reasons. Stress life testing is used for determining the safe infinite life of a component. Strain life testing is used for determining safe finite life and fracture mechanics to measure the damage tolerance of a part.
Partial list of ASTM Stress-Life based Fatigue Testing Specifications
ASTM D3479 Standard Test Method for Tension-Tension Fatigue of Polymer Matrix Composites
ASTM D7774 Standard Test Method for Flexural Fatigue Properties of Plastics
ASTM D7791 Standard Test Method for Uniaxial Fatigue Properties of Plastics
ASTM E466 Standard Practice for Conducting Force Controlled Constant Amplitude Axial Fatigue Tests of Metallic Materials
ASTM E467 Practice for Verification of Constant Amplitude Dynamic Forces in an Axial Fatigue Testing System
ASTM E468 Standard Practice for Presentation of Constant Amplitude Fatigue Test Results for Metallic Materials
ASTM E739 Practice for Statistical Analysis of Linear or Linearized Stress-Life (S-N) and Strain-Life (-N) Fatigue Data
ASTM E1012 Practice for Verification of Testing Frame and Specimen Alignment Under Tensile and Compressive Axial Force Application
ASTM E1823 Terminology Relating to Fatigue and Fracture Testing.
References
- Les Pook, Metal Fatigue, Springer, 2007, p 9-10
- STP-566 Handbook of Fatigue Testing, American Society for Testing of Materials, 1974, p Preface
- R.E. Little, STP-588 Manual on Statistical Planning and Analysis for Fatigue Experiments, American Society for Testing of Materials, 1975
- M.E. Fine and Y.W. Chung, Fatigue Failure in Metals, Fatigue Fracture, Volume 19, ASM Handbook, ASM International, 1996, p 63-72
- Mechanical Testing and Evaluation, Volume 8, ASM Handbook, ASM International, 2000, p 681-714
- George Dieter, Mechanical Metallurgy, McGraw Hill, 1976, p 403-450
- J.M. Hodgkinson, Mechanical Testing of Advanced Fibre Composites, Woohead Publishing, 2000, p 248-267
- Stephen P. Timoshenko, History of Strength of Materials, McGraw Hill, 1953, p 162-171
- Lee, Pan, Hathaway, Barkey, Fatigue Testing and Analysis, Elsevier, 2005, p 103-180
Looking for a reprint of this article?
From high-res PDFs to custom plaques, order your copy today!


