Before your analysis, take these steps: Assuring reliability in data collection
If you are measuring product characteristics to monitor quality and don’t perform R&R studies, a cloud of uncertainty surrounds your results.
Measurement system analysis provides the answers to a number of questions.
True or false: Measuring products, unlike other processes, is not subject to variation.
Of course this statement is false. Variation is inherent to any system, and the system of measuring products is no exception. How well you are measuring products can be assessed. Typically this assessment is done with a Repeatability and Reproducibility (R&R) analysis. One resulting statistic of that analysis is percent R&R, which gives an indication of how well you are measuring—in other words how much variation there is in the measurement system.
In R&R analysis, a set of operators, measuring devices, and products is measured under controlled conditions. The data is recorded and resulting statistics are calculated. These periodic studies give insight about variation in the measurement system.
R&R analysis, recording measurements collected by operators from instruments, is of course vital to a data collection process. In addition to using operational definitions to ensure measurement consistency, periodically performing repeatability and reproducibility tests and recalibrating gages is essential—but not enough.
If you are measuring product characteristics to evaluate and monitor quality and you do not perform R&R studies, a cloud of uncertainty surrounds your quality results. An R&R analysis can discern, for example, variation among different operators compared to variation among different measurement devices. Your quality measurements in the absence of this knowledge can be ambiguous; they might be close most of the time, but they may in fact not be.
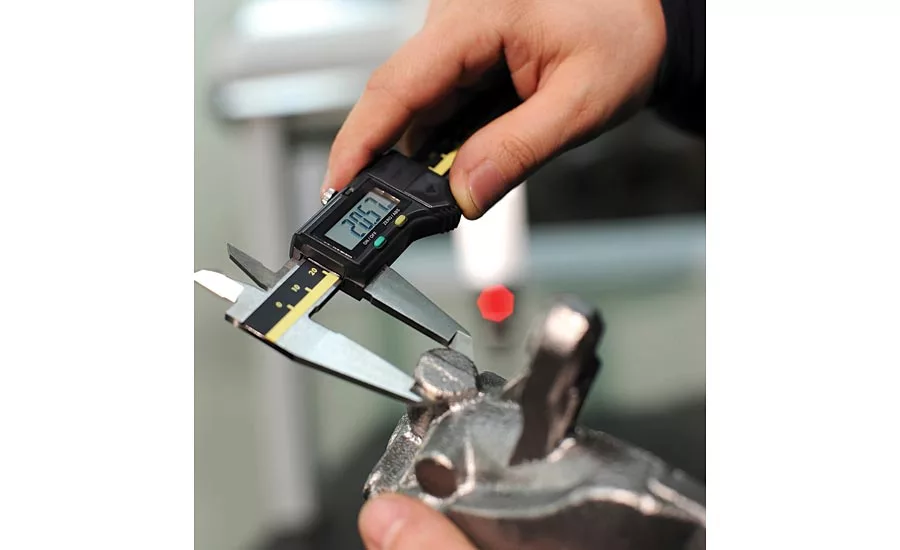
Collecting data with measurement instruments such as gages or calipers demands the use of repeatability and reproducibility (R&R) tests in order to assure that the collection will be accurate. Repeatability is the variation found in a series of measurements that have been taken by one person using one gage to measure one characteristic. Reproducibility represents the variation in a series of measurements that have been taken by different people using the same gage to measure one characteristic of an item.
The R&R test can also help to zero in on reasonable, result-based intervals for calibrating your devices. This can prevent wasted resources by calibrating too often or increasing risk by not calibrating frequently enough.
The R&R test is a way to keep on top of calibration records and history and evaluate data from measurement devices. Gages may be subject to variable factors such as temperature or magnetic and electrical fields that can affect their accuracy. Operator variability can be caused by different interpretations of a vague operational definition or differences in background, fatigue, or even attitude of operators. An R&R study will help to evaluate these kinds of variability, and the study will evaluate the overall accuracy of the measurement system.
In addition to pursuing R&R analysis to understand variation in equipment and among operators’ measurements, it is essential to assess the stability of the process, based on data generated by R&R analysis. Not knowing how well the measuring process is being done can undermine even the best use of tools for statistical process control.
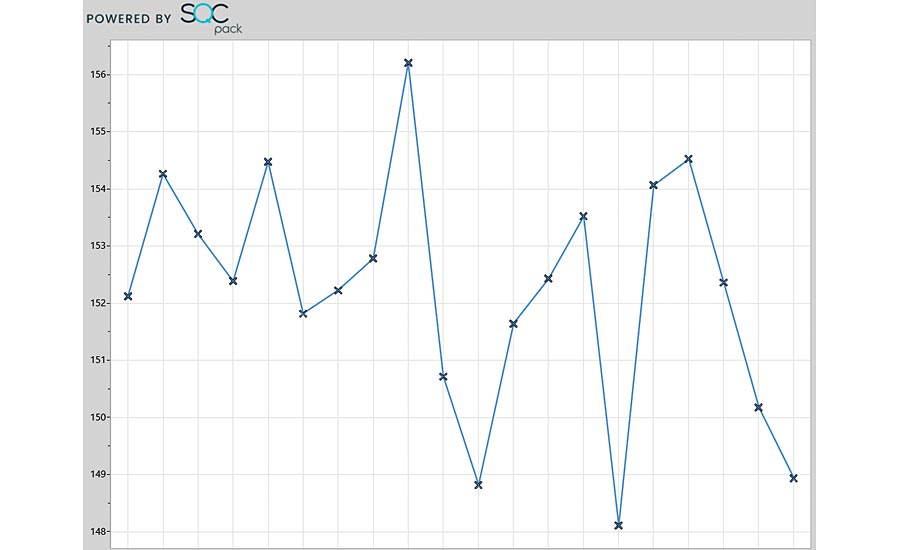
Consider this chart. ↑ Several parts were measured for a key quality characteristic and plotted on a run chart:
Next, an R&R study was done using the same operators and measurement devices, producing the results below:
Measurement Unit Analysis
Repeatability - Equipment Variation (EV)
EV = 0.2018 %EV = 17.61
Reproducibility - Appraiser Variation (AV)
AV = 0.2298 %AV = 20.05
Repeatability & Reproducibility (R&R)
R&R = 0.3058 %R&R = 26.68
Part Variation (PV)
AV = 1.1044 %AV = 96.37
Total Variation (TV)
TV = 1.1460
The percentage R&R indicates how acceptable the measurement system really is, with the criteria generally considered as:
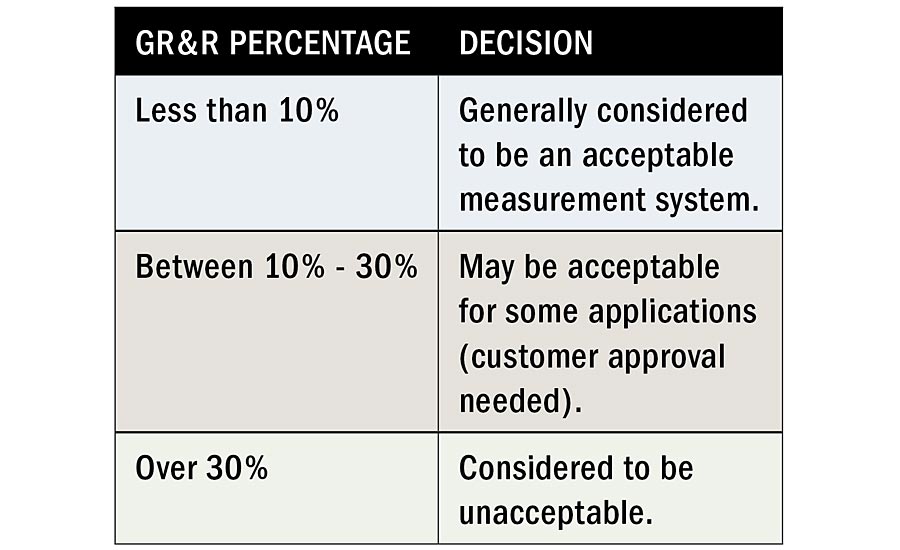
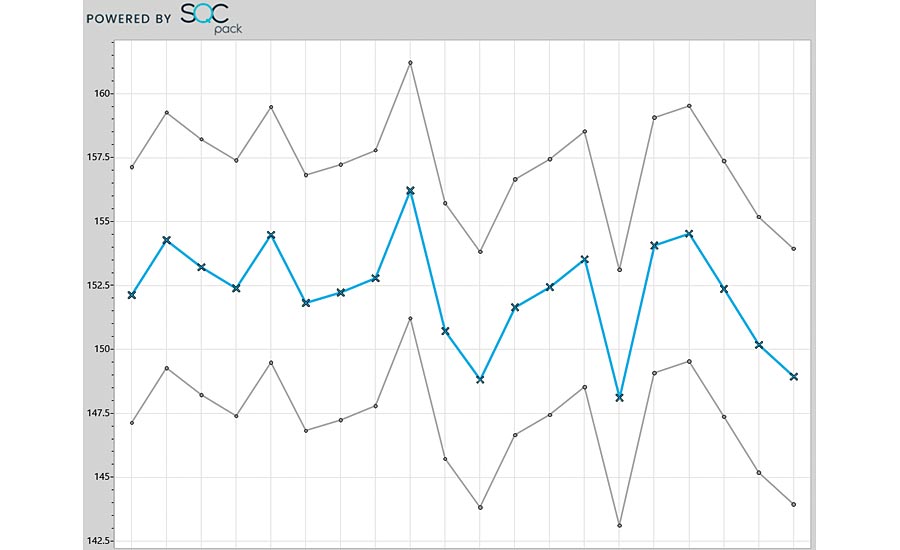
An R&R percent of 26.68 suggests that the actual data points themselves may vary by a significant amount. Conceptually, the actual value for each measurement could be within a range as shown by the grey lines above and below the blue data line. ↓
SPC charts and measurement system variation
If you are using statistical process control (SPC) charts on your measured values, the control limits are calculated so they take into account all the variation, including the variation in the measurement system. An out-of-control point on the control chart may be due to variation in the part, in the measurement devices, in the operators, or in the procedure for measuring. The control chart provides better information about how your process is behaving than the run chart, but without insight from an R&R analysis, it is difficult to peel away the variation being contributed by the measurement system.
Charts, truth, and the zone of uncertainty
When looking at any line chart of measured values, it is easy to assume the plotted points are the “truth.” If it says 1.026, then the real value must be 1.026. A better habit to establish is thinking about a zone of uncertainty around each plotted point. The real value is somewhere near here. If the point happens to be near an upper specification limit or near an upper control limit value, the zone of uncertainty means that the real value for the point might be outside the control limits or above the upper specification.
Aim for reducing the zone of uncertainty by using control charts and occasional R&R analysis to learn about how the measurement system is performing.
Conducting an R&R study
Measurement system analysis provides the answers to a number of questions. The question for a simple R&R study, for example, is whether the measurement system in use can adequately distinguish between or among units. The answer is produced by applying R&R methodology.
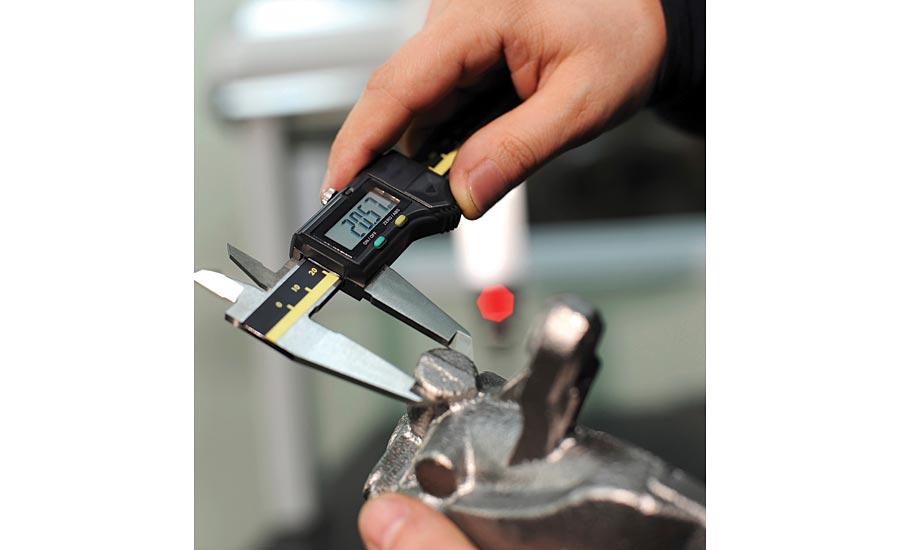
Collecting data with measurement instruments such as gages or calipers demands the use of repeatability and reproducibility (R&R) tests in order to assure that the collection will be accurate.
A number of factors affect the ability of a measurement system to discriminate among the units it measures. These may be categorized as those that typically contribute to any process variation:
- machine (the gage)
- operator (appraiser)
- method (method of measurement followed)
- material (units being measured)
- environment.
In conducting a simple study, an attempt is made to minimize or hold most of these factors constant. (Note: the study should replicate as much as possible the conditions under which the process measurement is occurring. This means that if production operators are making the measurements, the study should use production operators under the same conditions that exist when they are “normally” measuring the output. The study should not be conducted using quality technicians in a lab.) Therefore:
- One gage is used. (No inter-gage variation)
- One method of measurement is employed by all appraisers. (No variation generated by appraisers using different methods.)
- The same dimension on each part is measured each time. A further assumption is that each part is measured in the same place to eliminate the possibility of within-part variation. (No variation introduced because of different characteristics or because the measurements have been taken at different locations on the part.)
- The study is conducted under the same conditions that exist when the parts are normally measured. (No variation introduced by the location or environmental concerns of where the measurements are taken.)
The two items that are specifically varied are the number of appraisers and the number of units measured. The selection of these two factors is critical to meeting the objective of an R&R study.
Appraisers should be selected from those individuals who are currently measuring the output. If there is only one appraiser, then only one should be used in the study. If there are two or three, use two or three. If there are more than 4 or 5, use two or three “typical” appraisers.
A carefully conducted R&R study will assess the reliability of the measurement equipment and will help to determine the variation in the process. Once the R&R percentage has been ascertained, it is possible to identify the variability of data points that are collected for analysis.
To see improvement in processes and products, analysis is essential. This analysis is multi-faceted, with necessary attention given not only to the accuracy of gages, but to the variation that can ensue from measurement processes, differences among operators, conditions of environment, and other factors.
Determining variation among all factors and reducing it is key to assuring quality. Q
Looking for a reprint of this article?
From high-res PDFs to custom plaques, order your copy today!


.webp?height=200&t=1765568312&width=200 "ATEQ Metrology Laboratory,")