Quality Magazine logo
search
cart
facebook twitter linkedin youtube
  • Sign In
  • Create Account
  • Sign Out
  • My Account
Quality Magazine logo
  • NEWS
  • PRODUCTS
    • FEATURED PRODUCTS
    • SUBMIT YOUR PRODUCT
  • CHANNELS
    • AUTOMATION
    • MANAGEMENT
    • MEASUREMENT
    • NDT
    • QUALITY 101
    • SOFTWARE
    • TEST & INSPECTION
    • VISION & SENSORS
  • MARKETS
    • AEROSPACE
    • AUTOMOTIVE
    • ENERGY
    • GREEN MANUFACTURING
    • MEDICAL
  • MEDIA
    • A WORD ON QUALITY PUZZLE
    • EBOOK
    • PODCASTS
    • VIDEOS
    • WEBINARS
  • EVENTS
    • EVENT CALENDAR
    • IMTS
  • DIRECTORIES
    • BUYERS GUIDE >
      • Supplier Insights
    • NDT SOURCEBOOK
    • VISION & SENSORS
    • TAKE A TOUR
  • INFOCENTERS
    • Digital Quality Management Systems
    • NEXT GENERATION SPC & QUALITY ANALYTICS
  • AWARDS
    • ROOKIE OF THE YEAR
    • PLANT OF THE YEAR
    • PROFESSIONAL OF THE YEAR
  • MORE
    • Expert Columns
    • NEWSLETTERS
    • QUALITY STORE
    • INDUSTRY LINKS
    • SPONSOR INSIGHTS
  • EMAG
    • eMAGAZINE
    • ARCHIVES
    • CONTACT
    • ADVERTISE
  • SIGN UP!
Management

Charting the process with the help of a turtle.

February 15, 2019

Map the process. Chart the process. Get the turtle! (?)

Undoubtedly, you have heard—perhaps spoke—the first two statements. You are in the business of process improvement, after all. You want to be sure you have an effective quality management system (QMS). Process maps and flowcharts are essential for your QMS. However, these tools are mistaken for the same tool and used interchangeably.

Now, about the turtle. In this case, the mention of the shelled reptile refers to the turtle diagram, a helpful tool often overlooked when developing flowcharts and process maps. The purpose of this article is two-fold to assist you get the most out of our QMS:

  • Keep you from falling into the trap of equating process mapping with flowcharting
  • (Re)introduce you to the turtle diagram and its unique use

Before we address the turtle, let’s tackle the maps and charts.

Flowchart ≠ Process Mapping

The most likely reason process maps and flowcharts are mistakenly seen as interchangeable is that they look similar and use many of the same graphic symbols. However, the goals of each are different.

A process map “is an essential technique,” writes Miriam Boudreaux in her article, “On the Map,” (Quality Progress, November 2010) “for identifying all the processes that take place in an organization, as well as their interrelation. This visual tool makes it easy to understand the sequence in which these processes take place.” A process map is detailed, yet easy to follow and includes the following components:

  • Inputs
  • Core processes
  • Interactions shown by arrows
  • Outputs
  • Support processes

A process map then is meant to be of use to the company in a strategic way and to empower staff based on team and individual goals. The article “Knowledge Map and Process Map Overview,” published by APQC (October 2009), states that you should use a process map to:

  • Ensure everyone understands the shared vision of a process.
  • Provide an accurate snapshot of the process.
  • Aid in identifying non‐value added tasks.
  • Facilitate training of new employees.
  • Determine where in‐process measures need to be used.

The following table helps differentiate the process map and flowchart in more detail.

chart

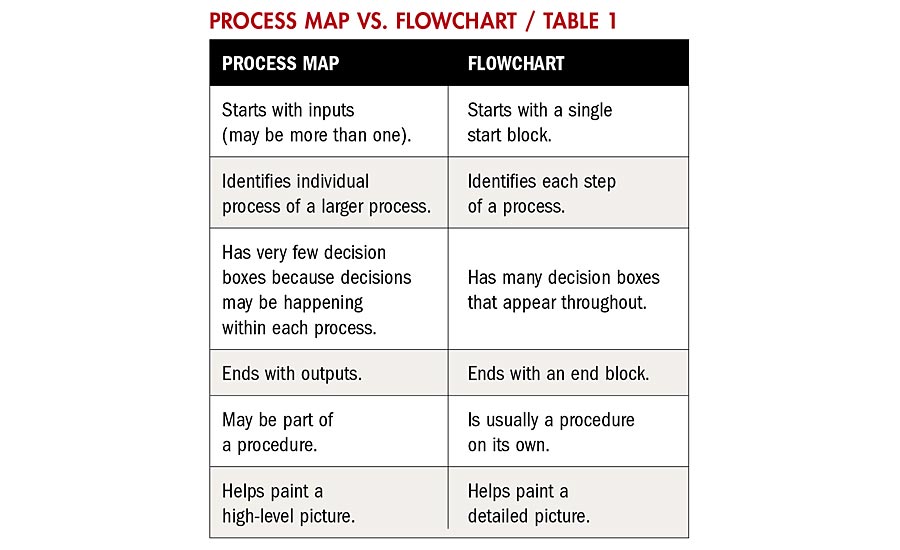
From “On the Map,” Miriam Boudreaux (Quality Progress, November 2010)

And, Now, Here Comes the Turtle

It is time to add another helpful and efficient layer to the process. Turtle diagrams and flowcharts have both been used to graphically display a process for a number of years. In “Best of Both Worlds,” (Quality Progress, April 2011) Gene Granowicz explains everything a process turtle diagram identifies:

  • Inputs: Includes internal and external customer requirements.
  • Outputs: The process’s results.
  • For a system process, this includes information, reports or data.
  • For a manufacturing process, the outputs include the finished product, statistical data and other manufacturing-related records, as well as any scrap from the process.
  • For any process, the actual output should represent the satisfaction of customer requirements.
  • What: These are the non-human resources needed to perform the task.
  • Who: These are the human resources needed to complete the process.
  • How: This provides insight into the operational controls required.
  • Measures: This is a listing of the performance indicators that will indicate the success or failure of the process.

Each of these items is visually represented in the turtle format.

As Granowicz explains, turtle diagrams are very useful for internal and external audits because they describe the inputs, outputs, and the means for measuring the process. The flowchart, while in some cases, addresses input and outputs, does not address measurement.

What can be helpful for your organization, is to combine flowcharts and turtle diagrams. By doing so, Granowicz states you have created a solid process map. This map can be rolled up into standards documentation.

Process maps, flowcharts, and turtle diagrams are three useful tools in your QMS. As you continue and strengthen your improvement efforts, be sure to explore each tool’s unique qualities.

Slow and steady. Keep the process improving.

KEYWORDS: process control quality management software quality management system (QMS)

Share This Story

Looking for a reprint of this article?
From high-res PDFs to custom plaques, order your copy today!

Recommended Content

JOIN TODAY
to unlock your recommendations.

Already have an account? Sign In

  • 2024 Quality Rookie of the Year Justin Wise 1440x750px banner with "Quality Rookie of the Year" logo inset

    Meet the 2024 Quality Rookie of the Year: Justin Wise

    Justin Wise is an exceptional individual who has been...
    Aerospace
    By: Michelle Bangert
  • Man with umbrella and coat stands outside while it rains at night looking at a building.

    Nondestructive Testing: Is there an ethics problem?

    I was a whistleblower who exposed fraudulent activities...
    NDT
    By: Dale Norwood
  • Unraveling Deflategate: Football stadium with closeup of football on field

    Unraveling the Tom Brady Deflategate

    The Deflategate scandal erupted following the 2014 AFC...
    Measurement
    By: Greg Cenker and Henry Zumbrun
Manage My Account
  • eMagazine Subscriptions
  • Newsletters
  • Online Registration
  • Subscription Customer Service
  • Manage My Preferences

More Videos

Sponsored Content

Sponsored Content is a special paid section where industry companies provide high quality, objective, non-commercial content around topics of interest to the Quality audience. All Sponsored Content is supplied by the advertising company and any opinions expressed in this article are those of the author and not necessarily reflect the views of Quality or its parent company, BNP Media. Interested in participating in our Sponsored Content section? Contact your local rep!

close
  • Key Takeaways for Quality Leaders
    Sponsored byComplianceQuest

    Key Takeaways for Quality Leaders from the 2026 Gartner Magic Quadrant™ for QMS

  • This image shows a person seated next to a Bobcat T66 compact track loader.
    Sponsored byPolyWorks by InnovMetric

    Supercharging Digital Gauging at Bobcat North America

  • Dorsey Calibration Lab photo by Tom LaBarbera Picture this Studios
    Sponsored byDorsey Metrology International

    Ensuring Product Quality in a Competitive Manufacturing Landscape

Popular Stories

This image shows a person seated next to a Bobcat T66 compact track loader.

Supercharging Digital Gauging at Bobcat North America

a professional in the aviation field performing maintenance, repair, and overhaul (MRO) work

Manufacturing Retention: Strategies for Improving Company Culture, Engagement and Skill Development

Dorsey Calibration Lab photo by Tom LaBarbera Picture this Studios

Ensuring Product Quality in a Competitive Manufacturing Landscape

2026 Quality Professional of the Year!

Events

June 22, 2026

Automate 2026

Automate is North America's largest robotics and automation event — and the best place to take your ideas from insight to impact.
 
Our show floor features the world’s leading automation solutions, from AI and robotics to motion control, vision systems, and more. Plus, our educational conference is second to none, led by the brightest minds in automation today.
 
Ready to transform the way you work? Take the next step at Automate.
July 14, 2026

Quality Leaders Forum: Better Communication, Better Quality Data

The Quality Leaders Forum is a quarterly, editor-moderated fireside chat series hosted by Quality Magazine, featuring candid conversations with senior manufacturing and operations executives shaping enterprise-level quality.

View All Submit An Event

Products

Lean Manufacturing and Service Fundamentals, Applications, and Case Studies

Lean Manufacturing and Service Fundamentals, Applications, and Case Studies

See More Products
Quality Podcast Channel Custom Content

Related Articles

  • Charting The Process With the Help of a Turtle

    See More
  • QM 1122 Minitab IC Topic 2 Takeda Boosts Image

    Takeda Boosts Drug Production with the Help of Machine Learning Models

    See More
  • image processing system

    Self-learning Robots Solve Tasks with the Help of an Ensenso 3D Camera

    See More

Related Products

See More Products
  • The Process Improvement Handbook: A Blueprint for Managing Change and Increasing Organizational Performance

  • Building Lean Supply Chains with the Theory of Constraints

See More Products
×

Stay in the know with Quality’s comprehensive coverage of
the manufacturing and metrology industries.

Newsletters | Website | eMagazine

JOIN TODAY!
  • RESOURCES
    • Advertise
    • Contact Us
    • Directories
    • Manufacturing Division
    • Store
    • Want More
  • SIGN UP TODAY
    • Create Account
    • eMagazine
    • Newsletters
    • Customer Service
    • Manage Preferences
  • SERVICES
    • Marketing Services
    • Market Research
    • Reprints
    • List Rental
    • Survey/Respondent Access
  • STAY CONNECTED
    • LinkedIn
    • Facebook
    • YouTube
    • X (Twitter)
  • PRIVACY
    • PRIVACY POLICY
    • TERMS & CONDITIONS
    • DO NOT SELL MY PERSONAL INFORMATION
    • PRIVACY REQUEST
    • ACCESSIBILITY

Copyright ©2026. All Rights Reserved BNP Media, Inc. and BNP Media II, LLC.

Design, CMS, Hosting & Web Development :: ePublishing