Quality Web Exclusive
“If you torture data long enough, it will confess to anything”
Defect tracking in a large corporation: Did the wheels fall off the bus?
This quote, attributed to Nobel Laureate and economist Ronald Coase (1910-2013), is all that really needs to be said or written to explain the confusion around the COVID-19 pandemic. Decades from now we will still be debating the source, the response, and the collateral damage from the biggest public health crisis of our generation. Indeed, COVID-19 has touched virtually every soul on the planet, and we will forever be playing the game “where were you when….”
It’s “where were you when” that offers a teaching moment to anyone that values accurate data, and depends on it to do their job. When the pandemic was revealing the true nature of its threat, were we looking for the right signals? Did the right people have the presence of mind to ask the right questions? Or were advocates of a certain theory torturing the data to fit it?
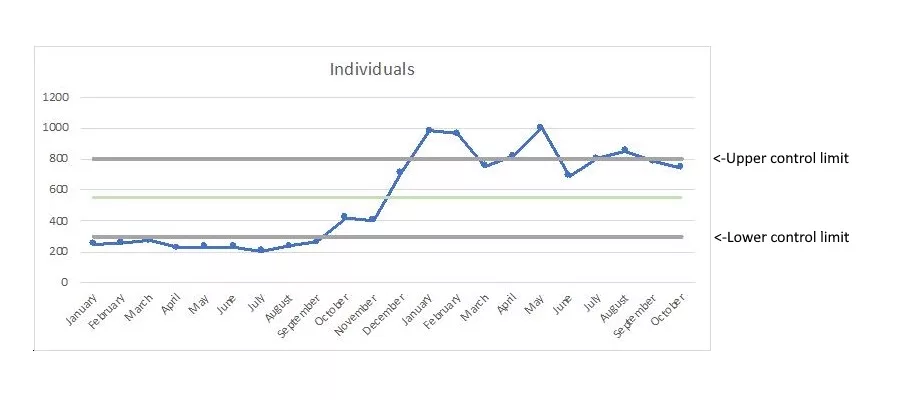
A company was recently tracking defects in production on a run chart. The chart demonstrated a huge spike in reported defects and, if the observer had not known better, it would be easy to conclude that the wheels had fallen off the bus. This was a case where calling in the cavalry could have been a justifiable reaction (and many were prepared to do so), however, it was revealed that “anonymous reporting” was implemented around September, which explained the spike. “We finally knew how many defects were really out there,” said the COO, delighted that while the defects were unfortunate; they revealed the quality improvement imperative that was hiding in plain sight.
More recently, as a director of a high volume call center, I was faced with managers screaming that the sky was falling due to an unexpected burst in volume. Were we looking at a trend, or an anomaly? Until I understood the nature of variation, I spent a lot of time fire-fighting when there was no fire at all. Similarly, quality managers need protocols to understand what represents a real threat, versus the background noise of what we call “common cause variation.”
The best way to look at common cause variation is to understand that the process you are evaluating is giving you the performance that you designed, whether you like it or not. This is an important perspective because nothing is gained by declaring war on the process or, worse, blaming the staff. Reducing common cause variation requires breaking the process down to find the “critical x,” the input variable contributing the most variation.
It is the special cause variation that offers direct clues to root cause of process failures, and a clear indication that the process is under the influence of forces not anticipated when it was designed. Early signs that there was a problem caused by COVID-19 started out as a special cause signal somewhere. These are the career-limiting signals that quality managers need to distinguish from common cause variation. To do otherwise is tantamount to being “asleep at the switch.”
In 1956, a company known as Western Electric (formerly a part of AT&T) codified a set of rules to assist engineers to recognize out of control and non-random conditions so that the proper interventions could be considered.
When seeking special cause variation, we often only see those data points at the extreme, like those that appear above the control limits in the chart above. But shifts, cycles and trends are also examples of special cause variation. According to the Western Electric rules, this includes 4 out of 5 consecutive points on the same side of the mean and at least 2 standard deviations from it, or 8 consecutive points on one side (rules 3 and 4). The complete rules are not much more complex than this, and can bring perspective to what is really happening in a process being monitored.
The other side of the coin is to regard every single undesirable data point as a special cause, when in fact the process is giving you that performance it was designed to produce. This would be a good time to remember what happened to Chicken Little.
The interpretation of data from COVID-19 requires us to leverage everything we know about operational definitions, data integrity, gage reliability and variation. No one would be blamed for being overwhelmed by it all. But blaming the data is not as productive as finding the truth.
Looking for a reprint of this article?
From high-res PDFs to custom plaques, order your copy today!


