NDT | Force Testing
A Case for Distance Accuracy in Force Measurement
When in doubt, specify a force tester with the tightest and most complete distance accuracy specification necessary for the application.
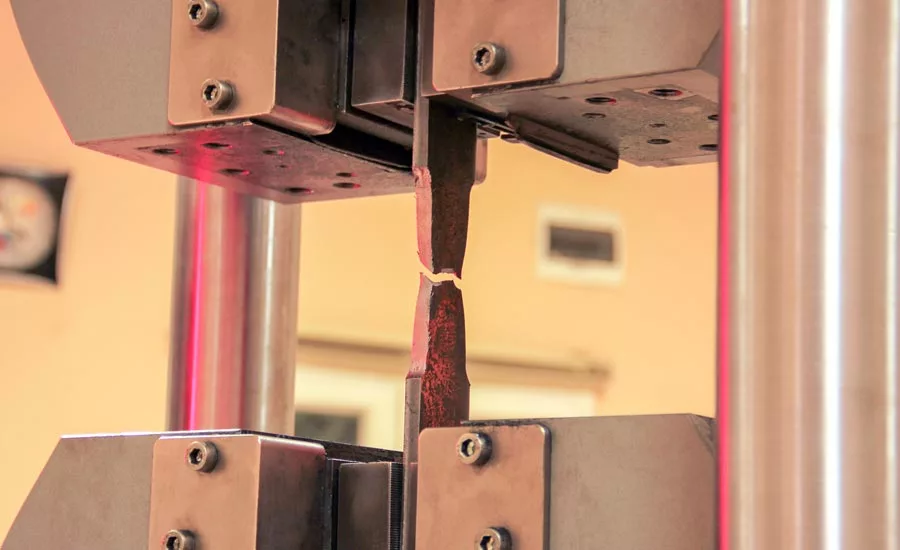
Image Source: Mark-10
Many of us are familiar with accuracy specifications pertaining to force measurement, usually a percentage of full scale or a percentage of reading. While this is broadly understood, the waters become a bit murkier in applications involving both force and distance measurements.
Many critical test results are values derived from distance, such as spring rate, modulus of elasticity, and elongation at failure. In cases like these, confident and reproducible test methods rely on distance accuracy, making it critical to understand a given force tester’s true distance measurement accuracy.
Spring Rate: The Basic Interplay Between Force and Distance
Spring rate is a popular test result that demonstrates the mutual importance of force and distance accuracies. A spring rate test can evaluate any ordinary tension or compression spring or, more generally, the stiffness of any mechanical part.
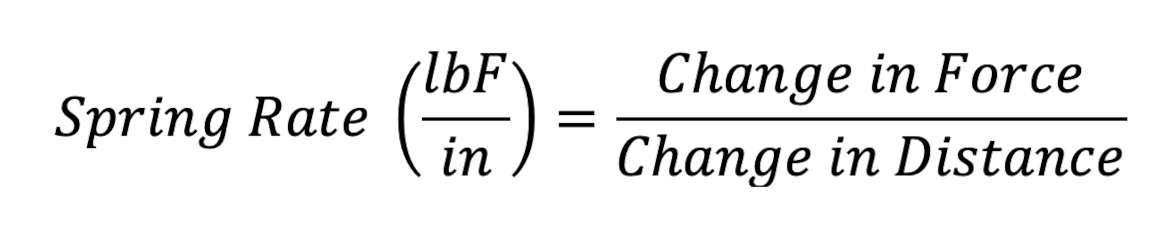
This test result characterizes how much force must be applied to a sample to create a given amount of deflection.
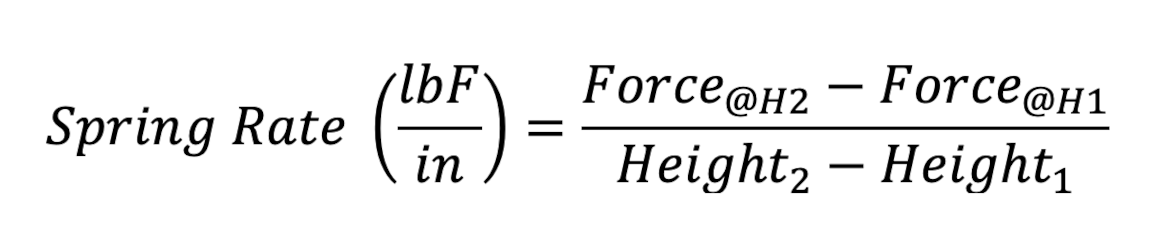
To visualize this, imagine wanting to know if the spring rate of a given compression spring is within its engineering tolerance. To make this determination, one would typically compress the spring down to a predetermined height (Height1) and measure the force (Force@H1) at that height. The spring would then be further compressed to a second height (Height2) and a second force measurement (Force@H2) would be captured. Inputting these values into the spring rate equation:
Although solvable, a downside of using this spring rate calculation to evaluate acceptance criteria is its inherent complexity. This calculation requires managing four different variables across two different dimensions.
Acceptance Criteria Within a Single Dimension
To simplify the calculations performed at the end of each test run, there is a workaround: use an offline calculation to determine what force value should be measured at each height. Then, by comparing the target force values (calculated before the test) to the measured force values (captured during the test), the test results and acceptance criteria are confined within just the force dimension.
To illustrate this simplified approach, let us assign some values to a hypothetical sample:
| Spring Rate | 50 lbF/in, ± 5% |
| Free Length | 4 in |
| Height 1 | 3 in |
| Height 2 | 2 in |
To solve for the Target Force at Height 1, these values are put into the formula:
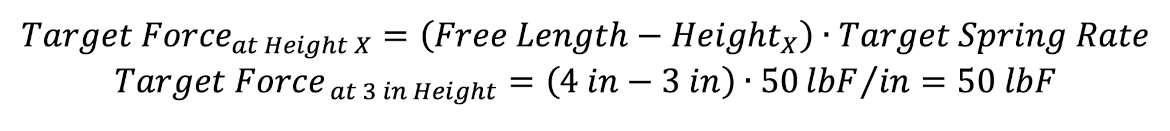
The target force values are 50 lbF and 100 lbF. Since the spring rate has a tolerance of ±5%, the acceptance ranges become 47.5 to 52.5 lbF and 95.0 to 105.0 lbF.
Blind Spot: Indirect Force Measurement Errors
While it is convenient to isolate all acceptance criteria within the force dimension, one pitfall of this approach is that users may gloss-over the measurement errors that occur within the distance dimension. This can be problematic because our testing application is designed to examine the relationship between force and distance. And, in this test, force is the dependent axis—meaning it depends on the independent axis, distance. So, any errors that occur within the distance dimension will necessarily impact results captured within the force dimension.
For example, suppose a force tester was configured to compress the spring down to a height of 3 inches. But, because of distance inaccuracy, the machine instead moved a bit further down to a height of 2.9 inches. Even though the machine display should show a measurement of 3 inches, it would remain unaware that the spring is actually being over-compressed by an extra 0.1 inch. With a spring rate of 50 lbF/in, the force channel would be measuring 5 lbF higher than if it were at a true 3 inch height.
Therefore, to determine if a given force tester is sufficiently accurate, we must account for inaccuracies in both its force and distance channels. Errors that originate in the force channel are usually quite easy to determine via calibration and verification against a known standard. Errors that originate in the distance channel take a little extra work to estimate.
Examining Test Machine Accuracies
Let us continue to flesh out this scenario by estimating the combined force measurement error for this application. And let us use some real-world specifications from an actual testing system, specifically a single-column force tester commonly used in lower force applications.
The clearest expression of distance measurement accuracy states the following:
- A maximum fixed error, ex. ±0.002 in
- Any error related to the position along the testing machine’s column
- Any error related to the amount of force produced
The last two accuracy components above are important because a single-column testing machine’s column deflects under load, due to the cantilever effect of the crosshead. The amount of deflection can vary greatly as the crosshead travels from the bottom of the column to the top.
The load cell (force sensor) also deflects under load. This amount of deflection is linear and can be easily predicted.
These components may be compensated via the machine’s software, however, not all force testers have this ability, nor are those with this ability necessarily factory-compensated.
For this exercise, let us assume that an in-tolerance sample could require forces up to 105 lbF, so it would make sense to configure our machine with a 200 lbF capacity load cell. Assuming an accuracy of ±0.1% of full scale, the testing system will carry an error of ±0.2 lbF throughout its measurement range while affording us ample measurement headroom.
As we move on to our control axis, we note a distance accuracy specification of ±0.002 in, valid over the entire length of stroke and over the entire range of forces. This specification will be uncommonly easy to work with, but makes our calculations easier.
In a previous example, we used the nominal spring rate to estimate how much force error would result when distance inaccuracy caused us to unknowingly over-compress a spring sample. We can use that same concept to characterize how much force error will be contributed by the distance accuracy specification:
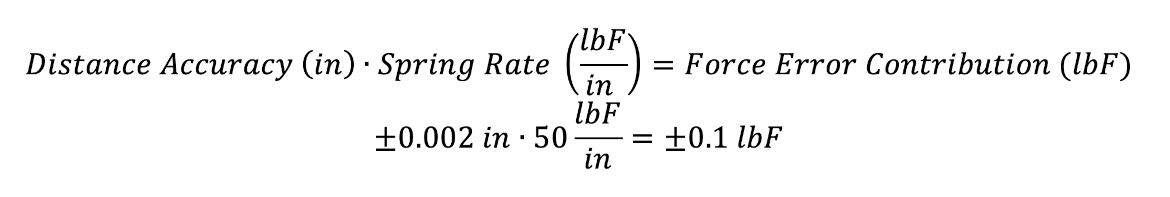
In this application, the error contribution from distance accuracy (±0.1 lbF) is estimated to be just half of the error that comes directly from the force channel (±0.2 lbF). Playing it conservatively, we can add these two error values together to arrive at a combined error estimate of ±0.3 lbF.
A Universal Quandary: How Much Accuracy Is Enough?
Of the two measurement points in this application, the 3 in height requires the tightest accuracy, so we should use that as our worst-case scenario. At this height, the force target of 50 lbF has a tolerance of ±2.5 lbF. Comparing the ±2.5 lbF engineering tolerance to our combined force error estimate of ±0.3 lbF, we can calculate the test accuracy ratio (TAR):
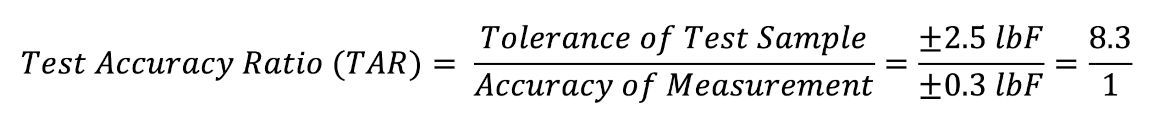
TAR is a simple way of relating the measurement accuracy of a testing system to the acceptance criteria for the testing application. The basic rule of thumb on TAR has been to have at least a 4:1 ratio, so the more than 8:1 ratio here should deliver a strong level of confidence to our conformance decisions.
This accuracy analysis points to a central question: How much accuracy is enough? Let us work through some examples.
Capturing a force measurement at the 3-inch height point, let us first consider an ideal scenario: our measured value lands right at 50.0 lbF. This is great because our sample appears to be precisely at the target force value, in the exact middle of our acceptance band.
But, since there will likely be some measurement error, there is a good chance that the true value is not exactly 50 lbF. Our combined force error was ±0.3 lbF, so we can be confident that the true value is somewhere between 49.7 and 50.3 lbF.
Expressing this TAR scenario graphically:
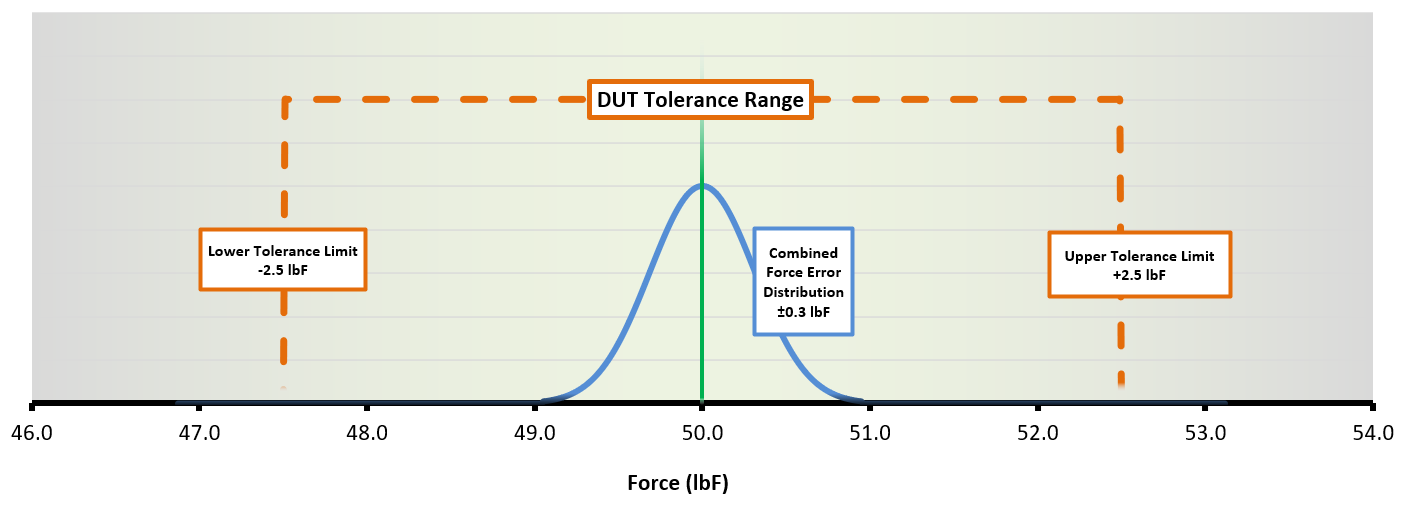
DUT Tolerance Range – 50 lbF | Image Source: Mark-10
Above, the vertical green line represents the target force value of 50 lbF. The blue bell curve is the measurement error distribution of ±0.3 lbF, showing where the true value is most likely to fall. The orange rectangle is the acceptance criteria of ±2.5 lbF.
Since even the outskirts of the measurement error distribution (blue curve) come nowhere close to the tolerance limits of the spring (orange rectangle), the odds of this sample actually being out-of-tolerance is minimal. As mentioned, having the measured value land right on the target value is the ideal situation.
But what happens if we instead had a measured value of 52.0 lbF? Since the upper limit of the acceptance band is 52.5 lbF, measuring 52.0 lbF still puts the sample within tolerance, right?
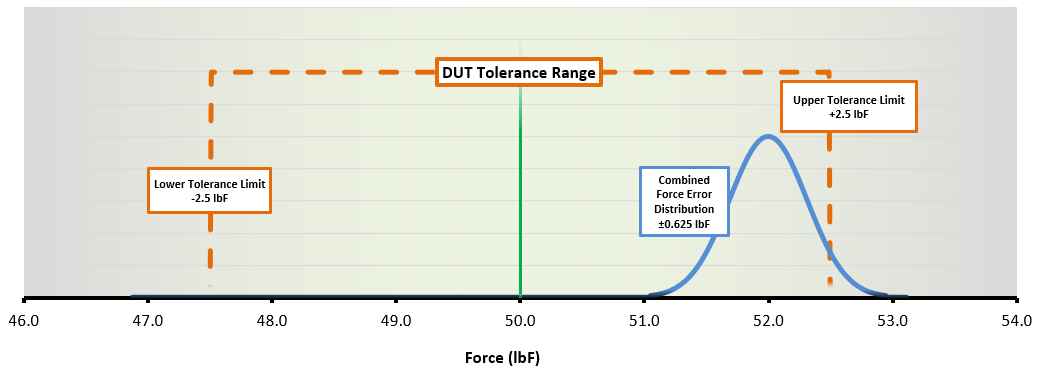
DUT Tolerance Range – 52 lbF | Image Source: Mark-10
Since the force tester under discussion affords us relatively tight accuracies, the error distribution of the measurement is tucked safely within the acceptance tolerance band. It would be safe to conclude that this sample is still within tolerance.
But we must acknowledge that there is less certainty in this conformance decision than when the measurement result landed right on the target value. The second TAR scenario demonstrates that tighter accuracy specifications become especially valuable whenever an in-tolerance sample veers closer to its tolerance limit.
Finally, let us reconsider the second measurement scenario, but this time using a less accurate testing system. Let us assume that it meets the minimum 4:1 TAR guidance with a combined measurement error of ±0.625 lbF.
Inserting these lower-performance specifications into the previous measurement scenario:
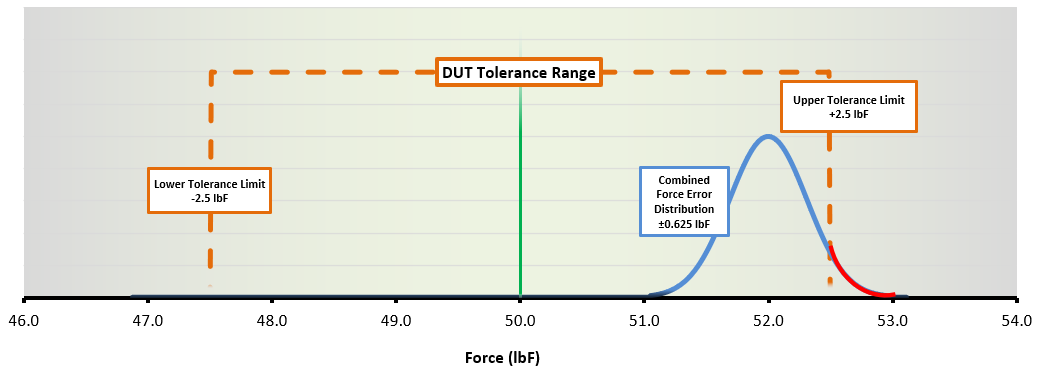
DUT Tolerance Range – 52 lbF red | Image Source: Mark-10
The concern here is the section of the error distribution (in red) that extends beyond the upper tolerance limit. The section in red shows us the added risk we will carry if we use this measurement as the basis for an in-tolerance conformance decision.
In Conclusion
When in doubt, specify a force tester with the tightest and most complete distance accuracy specification necessary for the application. As these TAR scenarios demonstrate, using a higher specification system allows users to accept in-tolerance samples more confidently without the baggage of added risk.
Looking for a reprint of this article?
From high-res PDFs to custom plaques, order your copy today!


